Satellite Derived Bathymetry Migration
From Laboratories to Chart Production Routine
Much has been said about Satellite Derived Bathymetry (SDB), but with the exception of SHOM, which led to the introduction of a number of SDB charts into the French chart series, next to nothing has been implemented within the international hydrographic community. This article aims to update readers as SDB, thanks to new generation satellites and modelling, seeing the light after going through a thirty years’ tunnel.
In 2014, detailed tests and analysis conducted by government hydrographers, cartographers and recognised satellite scientists operating for a number of projects initiated by the European Space Agency, the WWF and other stakeholders, were completed, extending the traditional research sites to several areas covering the South Pacific, the Indian Ocean, the Gulf of Mexico, the West Indies, the Eastern coast of Africa and as far North as the Shetlands.
Recently, SDB has even been used in the Gulf of Guinea to extract precise UNCLOS baselines out of the surfs bordering two adjacent African states. In short, SDB has been confirmed; not as an overrated exploration tool, but as a new sensor capable of providing calibrated and validated depths to the marine cartographer.
Indeed, the method has limits; the vertical precision achieved presently is not much better than 10 to 15% of the depth; the validated reach of SDB, normally in the order of 15 to 30 metres, can be significantly truncated when the environmental conditions are poor, but the 2015 Hydrographer can now make an assessment of these factors and implement a new tool to charter shallow depths and their known uncertainties.
Given time, charting liability should follow, as with previous sensors. All that hydrographers need now are standards, but this could be resolved rapidly as a number of national hydrographic offices such as SHOM and the UKHO are willing to join forces with the IHO to give a framework to this very promising technology.
Transmission of Light between Sea Bottom and Satellite Sensor
A possible reason for the disaffection of Hydrographic Offices with SDB may be caused by the paradoxically impenetrable equation of radiance that governs the transmission of light through a challenging environment characterised by many factors such as the height and direction of the sun, the wind and sea state, the satellite spectral bands, and three unknowns: the sea bottom albedo and the absorption and diffusion of light by the water column and the atmosphere.
Translated for laymen, the equation linking the ‘brightness’ or Luminance L, i.e. the quantity of energy received by the satellite sensor, and the depth is a function with a logarithmic declining shape, involving the absorption α, the scattering β, and the bottom reflectivity ρ: L = f(Zα, β, ρ).
The Two SDB Methods in a Nutshell
There are two SDB methods based either on the empiric comparison of satellite images against selected field observations or, at a later stage, on the law of physics.
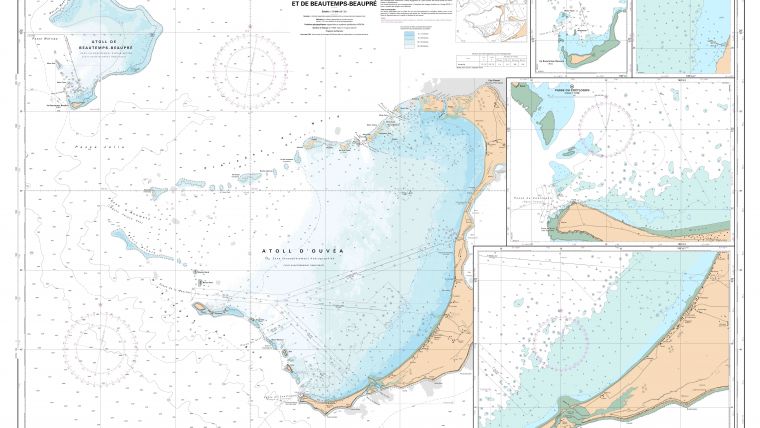
In early satellites, which had only one usable blue/green spectral band capable of seeing through the water, the empiric method consisting of producing a simple model by comparing a number of survey lines to satellite images was dominant. Assuming that the conditions prevailing in the atmospheric and water columns were unchanging, the model could be generalised to the whole image and depth layers could be produced with a reasonable level of confidence. However, this precluded mosaicing satellite images as the conditions would have been different, still required a bathymetric survey although limited, stringent selection of images, and outstanding experience of the analyst who had to cover no less than the three fields of hydrography, cartography and GIS. This early method has been used by SHOM since 1988, mainly to chart the atolls of French Polynesia and New Caledonia.
With the advent of the next generation satellites endowed with 5 to 6 usable bands such as Landsat 8 OLI and high-resolution systems such as Ikonos, KOMPSAT, Pleiades or WorldView 2, the sophisticated physics-based method, also called ‘radiance inversion technique’ could be introduced.
Still using the same principles mentioned above, but this time having access to all the unknowns thanks to the number of spectral bands and the development of sea floor libraries, the new method consists of computing depths by inverting the previous equation: Z = f-1 (Lα, β, ρ).
Needless to say, the ‘radiance inversion technique’, which processes each pixel individually, requires substantial computing capacity and good quality images, as free as possible from speckle and glint.
This method could be broken down into the twelve steps represented hereafter:
More progress should be expected with the ever increasing outpour of satellite images, bearing in mind that a decade ago, it could have taken years to select a single exploitable image.
Now, the satellite revisit frequency is such that images can be stacked and analysed in order to determine the zones of stability, free of plumes, transient and artefacts, therefore likely to yield more reliable SDB results (see Figure 3).
There is no need to calibrate the model against field surveys any longer although it is still necessary to have access to a limited number of proven depths to reduce the uncertainties that inevitably arise when no other in-situ knowledge of the site is available.
Bridging the Gap between Physics-based Methods and Practical Cartography
The practical difficulties start at the sixth step of the processing figure, when the Hydrographer receives a bathymetric model from the Satellite analyst containing several million pixels that must be uploaded into his GIS, transformed into a Digital Terrain Model (DTM) reduced to the chart datum, interpreted, validated and converted into a nautical chart.
Without going through fastidious details, we shall focus on the tenth step (validation & diagram of uncertainties), which determines entirely the capacity to produce IHO-compliant charts usable for navigation.
The physical model associates to each pixel a depth ranging in practice between zero and a maximum set value comprised between 30 to 50 metres. This value has to be analysed against an estimation of the range of the light propagation that can vary considerably depending on local environment, glint, turbidity, date and time of shooting, etc.
The main improvement brought by the physics-based method is that the uncertainty can now be calculated by analysing the various causes of errors affecting each pixel. Validation can then be achieved either by comparing the model against surveyed depths (Lyzenga empiric method) or by examining the structure of the depths recorded in the DTM.
One of the most exciting conclusions of the tests was to confirm that the model behaves like a Secchi disk and becomes ineffective after a certain depth, when the uncertainty is larger than the depth itself. In the various tests performed, ‘cut-off depths’ varied between 2 metres in the Shetlands and over 25 metres in New Caledonia, depending mainly on the glint and turbidity (Figure 6).
In the domain of validity thus determined, the precision of depths is better than 15%. Beyond the limit, the cut-off value itself guarantees a minimum depth comparable to those obtained by wire sweeps of the old and could be represented by a similar symbol where appropriate.
Diagram of Uncertainties and Zones of Confidence
Several questions arise when the wealth of physics-based information is depicted in the diagrams of sources and uncertainties: how many ZOC (Zones of Confidence) sections? Should uncertainties be depicted as absolute dZ or relative dZ/Z? Shouldn’t colour codes be introduced? etc.
These questions point at the existing IHO standards that need not be changed fundamentally but must be adapted to cater for the SDB before the emergence of possibly conflicting national practices.
Outlook
After almost 30 years of semi-experimental cartography, the Satellite Derived Bathymetry is finally coming of age. Not only can Hydrographers now model visible depths with an acceptable degree of precision, but they can also qualify their data and enter zones of confidence whilst retaining the metric horizontal accuracy of modern satellites and capacity to provide full coverage of very large areas.
Conclusion
Unless local conditions preclude the propagation of light, modern SDB could finally mean an end to most of the uncharted shallow areas listed in the IHO C- 55 publication.
However, this is not the end of history as better satellites endowed with better multispectral capacities will be launched and software will be improved to meet the growing demands of hydrographers turned into satellite analysts.
As SDB fundamentals are more or less under control, the priority is now to adapt the existing standards. This will need active engagement of the International Hydrographic Organisation, in line with the policy advocated by its current president.
Acknowledgements
The authors would like to thank the organisations that have supported the transition of SDB from R&D to hydrographic practice, i.e. GeoVille, METRIA, OceanWise, IGNFI, ESA, the World Bank, the WWF and SHOM, and to recognise the support provided by Dr F.R. Martin-Lauzer, (Eng. General, Armt. Corps), Chairman of ARGANS Ltd and other ACRI Group subsidiaries, for shedding light into the equations of radiance.
More Information
- Hedley JD, Roelfsema C, Phinn S, 2010. Propagating uncertainty through a shallow water mapping algorithm based on radiative transfer model inversion. Proceedings of Ocean Optics XX, Anchorage, USA.
- Louvart L, 2015. SDB contract experience feedback. SHOM Internal report.
Tournay J-P, 1999 Satellite Remote Sensing in SHOM. SHOM’s main SDB reference manual. - Tournay J-P, 2013. Pléiades experience feedback. SHOM Internal report.

Value staying current with hydrography?
Stay on the map with our expertly curated newsletters.
We provide educational insights, industry updates, and inspiring stories from the world of hydrography to help you learn, grow, and navigate your field with confidence. Don't miss out - subscribe today and ensure you're always informed, educated, and inspired by the latest in hydrographic technology and research.
Choose your newsletter(s)


