The Art of Bathymetry
Using 3D Printer Technology to Represent Survey Information
Great advancements have been made in three dimensional printing over the last few years and have made an impressionable impact across a variety of industries. 3D printings’ versatility can be incorporated into any industry that has some form of three dimensional design. An exciting application is to model point clouds from survey techniques to create three dimensional scaled models for visualisation and communication. In this article we will explore a new medium using 3D printed technology.
Over the last few years great advancements have been made to all forms of surveying in three dimensional data capture, whether it be multibeam echo sounders in hydrography, laser scanning in terrestrial and bathymetric surveying or photogrammetry through aerial surveying. Three dimensional data capture techniques produce vast amounts of information in the form of a point cloud from which useful information can be extracted. The information is usually translated to a two dimensional format in the form of a computer aided drawing (CAD), a Chart, a two and half dimensional digital format for visualisation or analysis to derive secondary products such as terrain metrics.
To convey three dimensional form cartographer’s employ varying techniques including colour gradients, contours, relief or sun shading to show variations in depth and the use of oblique angles instead of the typical orthogonal view. These techniques are not usually misinterpreted by spatial professionals but can be difficult for non-spatial individuals to comprehend. Colour gradients have varied elevations being represented by different colours, which can be difficult to interpret, particularly if a legend has not been provided. Shaded relief or shadowing can provide extra information to the viewer but has been known to cause optical illusions where depressions can appear as rises and vice versa. The use of oblique angles from a set perspective can show form, but may hide points of interest depending on the complexity of the information. The oblique angles are usually static images or displayed as a digital model that can be navigated on a computer, with a screen that is still two dimensional.
Utilising multiple open source software that was designed for GIS, point cloud manipulation and 3D modelling & animation; datasets captured by the Port of Melbourne Corporation and Deakin University were designed into 3D models and then sent to a 3D printing service provider.
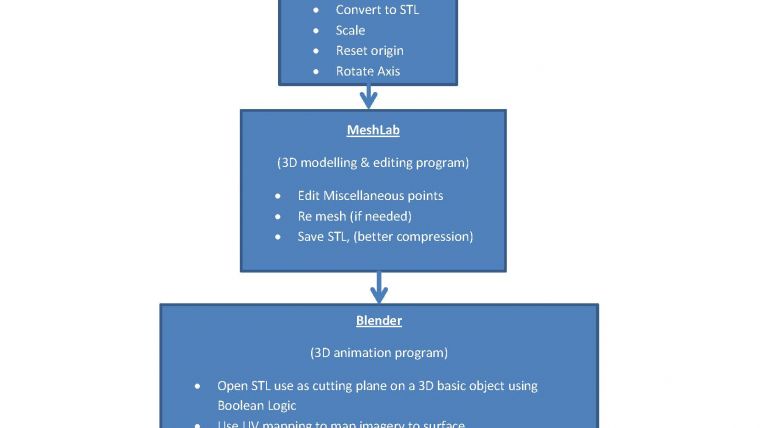
An initial learning phase was required to learn the various software programs required to manipulate the point cloud data into a 3D model suitable for print. The point cloud is either turned into a surface as a Digital Terrain Model (DTM) or a Triangular Irregular Network (TIN). A surface cannot be printed alone, as it is too thin to be considered printable by a 3D printer, so a 3D polygon or a cube is used to enclose the surface. The surface is then used as an intersecting plane using Boolean logic, anything above the surface is deleted while everything below is kept, resulting in an impression of the surface on the top of the 3D polygon, while leaving a flat base for ease of display. Orthometric photos or images of the modelled area can be used to apply textures to the model by wrapping around it and providing contextual information (Figure 1).
Important points to consider in creating a dataset to be 3D printed

Choose the right 3D printer for your intended purpose and associated material, which can vary from plastics to colour coded layered sand with epoxy. The models you see in this article have all been printed using the Shapeways 3D print service utilising ‘Full colour sandstone’. The material was chosen for its durability and its ability to display multiple colours. When creating a model to be 3D printed, the printer’s capabilities needs to be taken into consideration. For instance, the maximum printer dimensions for the models shown here were 250 by 380 by 200 millimetres with a resolution of 0.4 of a millimetre, but can vary by printer type and material used. This influences the scaling of the model to the printer dimensions and the level of detail you will be able to see in the final print. Resampling the dataset to a coarser resolution may be necessary if trying to model a large area. The model of Eliza Ramsden was at a resolution of 0.25m with an area of 5,577m2 (Figure 2) whilst the Port Phillip heads were modelled at 20m with an area of 93km2 (Figure 3). In our case, models had to conform to printer provider accepted file formats and restricted to file sizes of 64MB or 1 Million polygons. The 1 million polygon restriction can be problematic when trying to balance terrain size and detail. For coloured prints we found the best formats to use to be VRML and X3D, whilst for non-colour prints STL, OBJ and Collada were appropriate but likely to vary according to format requirements by print services.
Another apparent problem had to do with applying the colour. The colour was captured using an orthogonal geotiff of the survey areas with some of the models having the land terrain masked with aerial photography instead of a bathymetric colour scale. Using an open source 3D animation program the geotiffs were draped over the elevation models using a process called UV wrapping. There was not a single program that can handle all the processes to create a 3D print and was therefore a combination of several programs, all with different intended purposes. Hopefully in the future survey software can adopt some of the formats and functionality to future versions of their software for standard 3D print formats.

The methodology has been applied to multibeam bathymetry, UAV captured Photogrammetry and DSM models, terrestrial and bathymetric Lidar data and satellite derived elevation data either as a single dataset or combination of multiple datasets to form a comprehensive model. The final models are not limited to being 3D printed and have been used in other 3D virtual viewing mediums and show promise as communication tools for the rapidly developing field of augmented reality. The Augment website and mobile phone application allow the models to be uploaded and shared. A tracker can be a customised information sheet that can include the company logo or a simple Quick Response (QR) code. When the application is run on your device it reads the QR code or the unique layout and overlays the 3D model over the camera view, allowing the user to explore the model (Figure 4).
Dr Ierodiaconou from Deakin University, School of Life and Environmental Sciences, Warrnambool, Victoria has been exploring the value of 3D printed models as communication tools (Figures 5 and 6). He found an immediate benefit with 3D printable products for communication of environmental values. This includes the application of low cost unmanned aerial vehicles for defining endangered hooded plover habitats on nesting beaches funded by Birds Australia. The first model (Figure 5) shows storm cut of the beach face whilst providing quantitative spectral and elevation data tied to a datum using RTK GPS (Real Time Kinematic GPS). Time series analysis allows the investigation of management interventions such as the spraying of the invasive Marram grass that has been linked to stabilisation of mobile sand dunes and steepening of the beach face. The second model (Figure 6) shows the integration of terrestrial imagery and elevation combined with high-resolution seafloor mapping data (10cm resolution) of Refuge Cove, a popular anchorage on the east coast of the most southern tip of mainland Australia. The project was funded by Parks Victoria and multibeam sonar data was captured using a Kongsberg 2040C fitted to Deakin’s 9.2m research vessel Yolla. “We find it an amazing way to communicate the value of marine ecosystems, showing a direct link to the terrestrial realm with continuation of headlands and drowned coast and river features from lower sea level stands”.
The Port of Melbourne Corporation use the models at sponsored events and festivals, and the response from the public is invariably positive. “It’s always more effective to show, rather than tell, especially when discussing something that cannot ordinarily be seen, and the 3D models are very effective engagement tools in this regard. These 3D models can provide an immediate sense of spatial relief with minimal interpretation or miscommunication through cartographic techniques especially when communicating with non-spatial professionals” Ierodiaconou said. Whilst three dimensional fly throughs will always have a place in science communication (see an example from Wilsons Promontory Marine National Park) new communication mediums provide exciting opportunities whether in hard print where you can feel the texture of the spatial domain or augmented reality for immersive experiences with unlimited field of views.
Video
Wilsons Promontory Marine National Park

Value staying current with hydrography?
Stay on the map with our expertly curated newsletters.
We provide educational insights, industry updates, and inspiring stories from the world of hydrography to help you learn, grow, and navigate your field with confidence. Don't miss out - subscribe today and ensure you're always informed, educated, and inspired by the latest in hydrographic technology and research.
Choose your newsletter(s)


