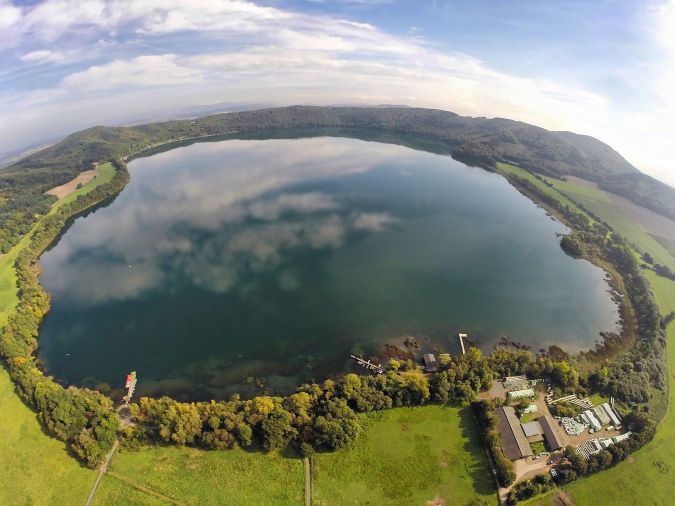
In collaboration with four French, Belgian and German geoscience laboratories, iXblue’s sonar systems division recently mobilized its SeapiX 3D multibeam echosounder and Echoes 10,000 sub-bottom profiler to image the Laacher See. Located in the Eifel region of Germany, the Laacher See is a caldera volcanic lake measuring two kilometres across, formed by an eruption 12,900 years ago. The main goal of this scientific mission was to detect gas bubbles that would help to better understand the current activity of the volcano.
Gas can trigger volcanic and limnic eruptions and can be easily detected using hydroacoustic methods. However, its quantification has until now remained complex due to the 3D structure of clouds and the acoustic interactions between bubbles. The different bubble clouds need to be accurately mapped, to monitor their evolution and to dissociate different gas origins to evaluate the volcanic risk, which is considerable in aquatic environments.
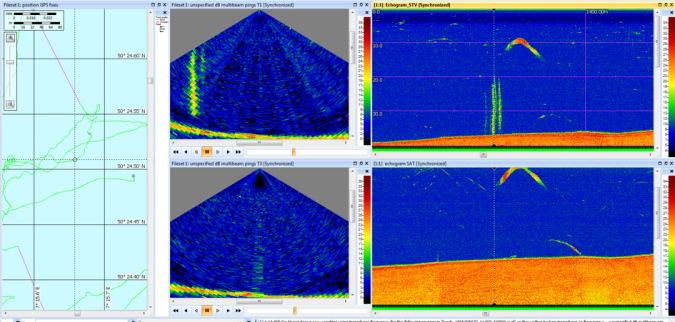
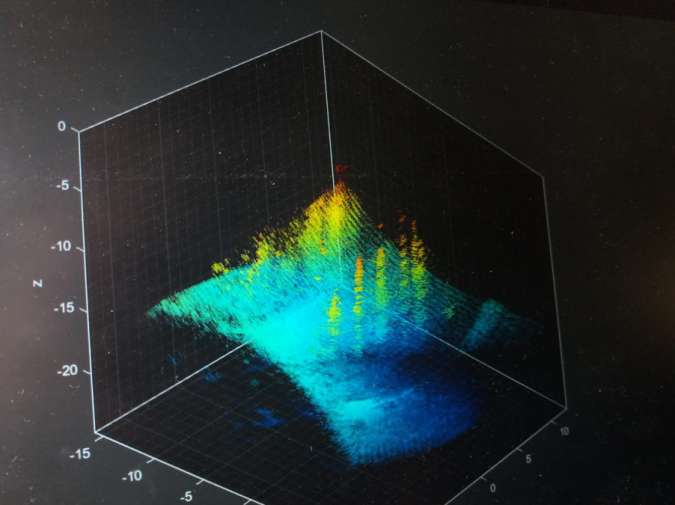
The use of two hydroacoustic instruments designed and built by iXblue, the SeapiX multibeam echosounder (150kHz) and the Echoes 10,000 (10kHz) sub-bottom profiler, proved to be of great help during this scientific expedition on the Laacher See. Remotely controlled at several hundreds of metres, the SeapiX sonar recorded the lake’s bathymetry and different backscatter signatures of elements in the water column. The target strength backscatter signature of the elements makes it possible to distinguish fish, macrophytes and gas bubbles. Statistics were conducted on the acoustic signatures at different locations. Several concentrated colocations of gas flares were thus identified and suggested that the bubbles were very small (~35µm). This could explain why the geoscientists had not observed gas bubbles using a camera mounted on an ROV at these locations. It also raises new perspectives for improving CO2 budget modelling from volcanic bubble releases.
4D monitoring of gas flare dynamics using static SeapiX measurements
Caudron et al. (2012) recently showed that degassing underwater is one of the earliest precursors to volcanic eruptions, as observed in a caldera in the Philippines (Bernard et al., 2021). Almost ten years ago, they derived a first empirical law to estimate CO2 fluxes in volcanic lakes using single-beam echosounders (Caudron et al., 2012). However, robust methods taking advantage of high-resolution equipment, such as multibeam sonars or distributed acoustic sensing (DAS) systems, are required to provide reliable quantification. In this study, SeapiX was able to record gas diffusion in the water column as a bubbling dynamic through time. With its 120° per swath scanning and target strength gas bubble identification, this study introduces new perspectives to anticipate gas-driven volcanic eruptions.
Geohazard history and gas diffusion in sediments using Echoes 10,000
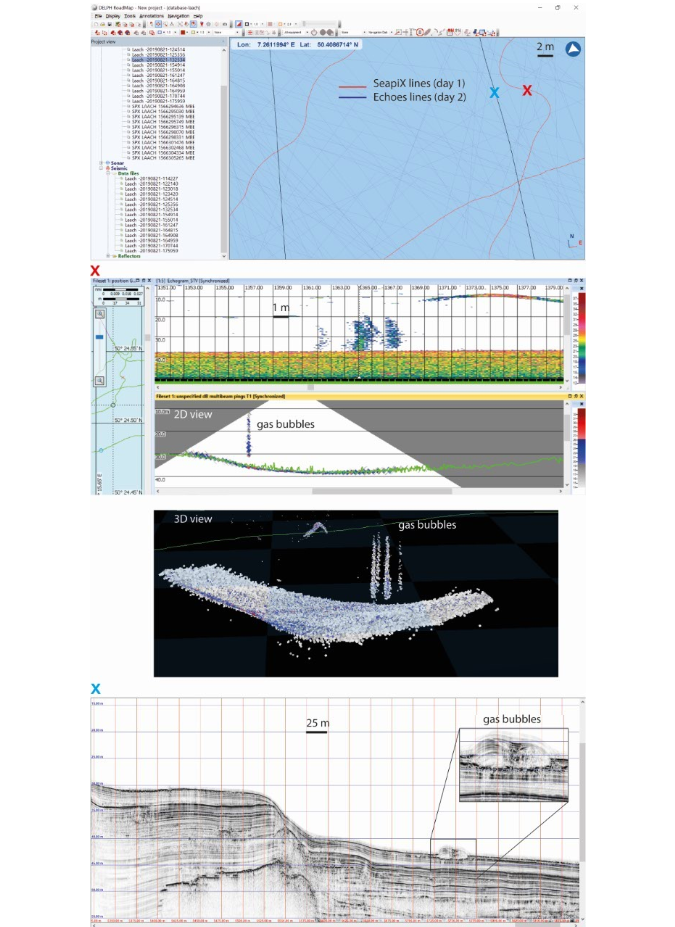
The Echoes 10,000 provided high-resolution images of the architecture of the lake deposits, which could be visualized in real time using the Delph Geo Software (iXblue software suite for the acquisition, processing and interpretation of geophysical data). Derived from 30 years of expertise in low distortion and high efficiency power amplifiers, Echoes technology ensures that the acoustic signal transmitted is very close to the theoretical CHIRP waveform. The resulting seismic profiles more accurately reflect changes in the nature and texture of sediment layers. More than 40 metres of sediment penetration provided high-resolution images of the sediment architecture (with a theoretical 8cm resolution), suggesting great potential for paleoenvironmental and paleoclimatic reconstruction. Indeed, combined with sedimentological analyses of sediment cores, 3D modelling of the main reflectors allows reconstruction of the past remobilization of materials derived from extreme events and potentially linked to past volcanic and/or earthquake activities. Finally, the quality of the signal revealed the presence of gas diffusion in the sediment, which was compared to the SeapiX dataset (see Figure 2 and video). Using this scientific approach, it was possible to ensure that vertical structures were indeed gas flares (and not macrophytes), and to provide the best accuracy of target strength measurements.
Conclusions
Thanks to the SeapiX selectivity function, different target strength signatures will help researchers to identify different categories of elements and to best understand the physics of gas bubbles, their generation, origins and dynamics. Since SeapiX was used together with a gas probe installed on the lake for long-term monitoring, it has great potential for better understanding the life cycle of gas generation by combining the acoustic data from the two different systems. It also introduces new insights for developing an automatic gas detection module using the SeapiX software.
Real-time and multiproxy hydroacoustic data contribute to ongoing and global scientific efforts to increase the predictability of volcanic and limnic eruptions. Intrinsic and spatial dynamics of volcanic gas bubbles is thus the cornerstone for developing the new generation of early warning systems that is needed for future risk assessment. Echoes 10,000 and SeapiX have a part to play in this.