Capturing Convection: Glider Validated Modelling
Can Underwater Gliders Be Used to Check Ocean Forecast Accuracy?
Recently, three unmanned underwater vehicles (UUVs) were deployed in the northwest Mediterranean Sea to monitor open-ocean convection via changes in the local density structure. Mixed-layer depth and thermocline response to buoyancy flux were extrapolated from in-situ profiles and used to infer the occurrence of deepwater formation events. The high-resolution data set acquired has been used to assess ocean forecast model performance in this area. The advantages of employing glider data sets in further validation schemes are discussed here.
Forecast models are employed by the oceanographic agencies for meteorological and commercial shipping applications, as well as in naval sonar propagation studies, where mixed-layer depth (MLD) is crucial. Often, dynamic ocean features, such as eddies or convection plumes, occur on spatial scales that cannot be resolved by these models. These ‘sub-grid scale' processes, which are not explicitly rendered, must be represented by a single descriptive parameter.
Consequently, the convection driven, deepwater formation areas of the northwest Mediterranean Sea (NWMS) present a consistent challenge to ocean modellers and forecasters alike. To maximise the accuracy of short-term forecasts, models often employ assimilation schemes. These are designed to force the model back to the observed state by incorporating data from a multitude of in-situ and remote sources. However, there are
a number of pervading issues with existing systems. Arrays and floats are static and sparse, respectively, limiting the spatial information that they can provide while satellite sources are unable to monitor sub-surface processes. To compound these challenges, assimilated source cannot be used to assess subsequent forecasts, as only independent data sets remain unbiased. Here the author discusses ways in which UUVs can be used to address these issues.
Glider mission
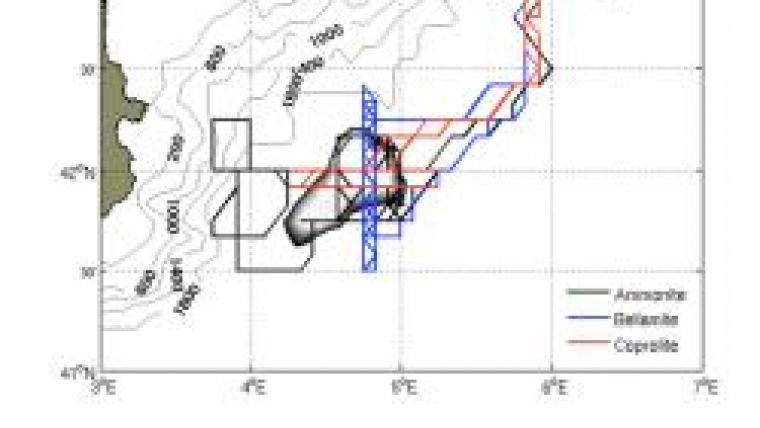
The Slocum Battery glider is a buoyancy driven autonomous vehicle developed by the Teledyne Webb Corporation. Deployable for up to a year, the unit follows a ‘saw-tooth' profile in the top thousand metres of the water column, recording temperature, conductivity and pressure using a Seabird41 CTD (calibrated against the 2008 DOCUNUG cruise) (Figure 1a). Upon surfacing, the glider reports position (and profile data, via Iridium satellite link) and can be remotely redirected as necessary. This makes these vehicles ideal for the adaptive real-time sampling of small-scale features where both spatial and temporal resolution is critical. Three such gliders were launched in the Gulf of Lions (3.5-6oE, 41.5-43oN) in the winter of 2008 (sampling period 30 January to 15 April). Gliders Bellamite and Coprolite, performed a series of meridional and zonal transects across the known area of convection, whilst the third, Ammonite, was used to survey the wider area as necessary (Figure 1b).
Profile compatibility
The profile described by gliders does not promote the easy visualisation of results or feasible comparison with daily model products. One solution to this is to interpolate the glider data onto a regular temporal and spatial framework. Here, a 1/12o horizontal and 20m vertical grid was chosen, as it was compatible with the UK Met Office Forecasting Ocean Assimilation Model (FOAM) (in reality the model z-coordinate is also interpolated onto 20m depth levels as a suitable compromise). Additionally, to cater for the temporal incompatibility between daily model products and ‘continuous' glider sampling, the glider time series was split into 6-hourly bins representing the approximate time it takes for the glider to complete one downward and upward sweep (i.e. a single ‘tooth'). The resulting data set yields twelve profiles per day, four for each glider, which can be directly compared to those modelled. Through this approach co-located time series of temperature, salinity, mixed-layer depth and ocean heat content could be extracted and compared (Figure 2).
Ocean convection
Convection in the NWMS is a three-stage process driven by the atmospheric cooling effect of the Mistral winds. Gyre driven isopycnal doming preconditions the area such that wind-driven heat loss can induce a mixing and sinking of the surface layers in the newly homogenised water column (Figure 3c). The MLD, defined as the depth at which the local density differs from the surface value by 0.01kgm-3, is a good indicator of ocean response, significantly deepening during convection. The observed and simulated MLD correlate with 99% significance, showing a consistent response to NCEP derived atmospheric forcing. Analysis of the buoyancy flux yields
a similarly positive result. Slight inconsistencies in the prescribed properties of the western Mediterranean deep water (WMDW) (Figure 2e,f) aside, the phases of convection appear well represented.
By implementing an algorithm that compares the glider MLD to all model values in a given search radius, it is possible to assess how well the location of the convective event is simulated. Although widening the search area results in a lower RMS discrepancy between the two co-located time series, the gains are not appreciable. The indication is that the location of deepwater formation is appropriately prescribed.
Event Scales
Thus far, glider data has only been considered as a time series. However, by treating each ‘sweep' across the convective zone separately, information on the scale of events can be derived. Spatially, this approach can be visualised by overlaying the meridional and zonal glider paths over their correspondingly evolving model fields (Figure 4). Similarly, the temporal dependence can be ascertained by compiling a time series from all three gliders as they cross the central point - the most data rich in sampling terms. Variogram analysis of the physical fields suggests that although the MLD responds in a manner consistent with observations, temperature and salinity are more diffuse in the model. This increased diffusion is manifest as longer integral length and time scales - a finding consistent with the increased penetration of deepwater that was noted above (Figure 5).
Advantages / Limitations
The techniques above outline how, in a comparatively short sampling period, gliders can be deployed to capture some of the most energetic ocean processes. In these cases, ship based monitoring of these phenomena would be impractical in terms of sampling resolution or prohibitively expensive. In addition, there is no question mark over the independence of glider data sets, making them suitable for model validation.
However, there are limitations to a glider approach. The spatial and temporal components of the glider time series are inseparable (they never remain stationary) so assumptions must necessarily be made when extracting information on integral scales. Further, gliders are limited in the sensors that they can transport. For example, the power required to fit an ADCP is such that the deployment time is severely compromised. Current data can be derived from the glider surface positions, but only on a depth averaged basis.
Looking forward
UUVs offer a unique look at ocean phenomena, providing high-resolution data sets that are able to capture features on some of the finest scales. Subsequently, this allows investigation of the response of the mixed-layer depth and ocean heat content to atmospheric conditions. Careful manipulation of these data sets adapts them to a form that is suitable for comparison with operational forecast products. These comparisons can be used to assess the performance of models in areas that are oceanographically complex. Further, although they are not yet fully operationally functional, methodologies to adapt glider data to assimilation schemes are already being tested, suggesting a bright future for this technology.
Acknowledgements
Thanks to David Storkey (UKMO) and Dr. David Smeed (National Oceanography Centre, Southampton) for data provision and project supervision, respectively.
Further reading
Griffiths, G., Merckelbach, L., Smeed, D., 2007. On the performance of three deep-diving underwater gliders. Proceedings of Oceans 2007, Aberdeen, June 2007. IEEE, Piscataway. ISBN: 978-1-4244-0635-7.
Marshall, J., Schott, F., 1999. Open-ocean convection: Observations, theory and models. Reviews in Geophysics, 37, pp1-64.
Schulman, I., Rowley, C., Anderson, S., DeRada, S., Kindle, J., Martin, P., Doyle, J., Cummings, J., Ramp, S., Chavez, F., Fratantoni, D., Davis, R., 2009. Impact of glider data assimilation on the Monterey Bay model. Deep Sea Research II, 56, pp188-198.

Value staying current with hydrography?
Stay on the map with our expertly curated newsletters.
We provide educational insights, industry updates, and inspiring stories from the world of hydrography to help you learn, grow, and navigate your field with confidence. Don't miss out - subscribe today and ensure you're always informed, educated, and inspired by the latest in hydrographic technology and research.
Choose your newsletter(s)


