Changes to data sourcing in modern times
The new data paradigm
Seaports, waterways and climate are inextricably linked. Weather anomalies change bottom contours and destroy aids to navigation, compromising safety. In the past decade, maritime applications, maturing marine technologies and crowdsourcing have given mariners access to near-real-time hydrographic data. The 3D forward-looking sonar is one example of the technology navigators are using to create their own 3D local chart database. Thousands of vessel operators are now contributing to online navigation safety databases. This article provides examples of how traditional hydrographic data sourcing continues to change in the wake of apps, intra-vessel communication and 3D sonar hardware/software technology.
Crowdsourcing apps
In the past decade, some 600 maritime and crowdsourcing applications (apps) have provided mariners access to critical post-storm hydrographic data resulting in fewer groundings. For example, in 2015 the author avoided grounding a 5.5’ draft vessel in the Intracoastal Waterway in multiple inlets affected by winter storms based on just-in-time crowdsourced sounding data. This valuable information was accessed daily through the ActiveCaptain Application.
Hurricane Matthew provided the perfect backdrop to showcase the value of instantaneous crowdsourced navigation safety data. Jeff Siegel, CEO of ActiveCaptain, the US based online real-time interactive vessel guide, characterized the huge ActiveCaptain data stream in the aftermath of the hurricane as ’Crowd Sourcing’s Finest Hour’. Hundreds of vessels cruising south and north along the Atlantic coast of the USA seek the calmer conditions of the Intracoastal Waterway (ICW).
Data capture before and after Hurricane Matthew
Just before and after the arrival of Hurricane Matthew, ICW vessel traffic multiplied. As a result, tech-savvy mariners were entering large volumes of data on ActiveCaptain. The data included time-stamped real-time water level information, defined inlet shoals, closures of waterways, bridges and marinas and missing aids to navigation (ATON). While commercial Florida ports were closed to the public and still conducting post-storm hydrographic surveys, cruisers armed with cell phones and iPads using the ActiveCaptain App were able to access real-time information to determine how to navigate safely in the shifting channels of the ICW and where they could still buy fuel.
Thousands of vessel operators are now acting as sensors contributing to online hydrographic databases. The National Oceanic and Atmospheric Administration (NOAA) and US Coast Guard (USCG) tap into these databases to prioritize resources and anticipate chart updates. Both the USCG and NOAA review reports of shoaling and missing ATON data from cruisers while tracking ocean debris and hazards through crowdsourcing Apps.
When charts don’t measure up
In addition to maritime Apps, the 3D Forward-looking Sonar (FLS) technology/software improvements provide a growing number of vessel operators with the ability to safely navigate ‘skinny water’ in dicey conditions. For example, marine traffic near the Poles has increased nearly four-fold to almost 700,000 cruise vessel movements in the past 15 years according to Midge Raymond. This has both US Coast Guard and NOAA’s attention.
In August 2016, Exercise Arctic Chinook simulated the rescue response to a passenger ship casualty off Kotzebue, Alaska in the Bering Sea. Regions in the remote Bering Sea are described in the US Coast Pilot (chart 16006) as “only partially surveyed and the charts must not be relied upon too closely, especially near shore.” Typically, vessel accidents near the Poles involve hull breaches due to ice or unexpected groundings. There has been a marked increase in purchases of 3D FLS by prudent operators of Arctic and Antarctic bound cruise ships and mega-yachts. This technology offers the navigator a means to view a detailed 3D forward look at the seafloor, uncharted rocks and potentially damaging submerged ice. When pushing the navigation safety envelope a 3D FLS adds a significant margin of safety.
Shifting riverbeds, polar and glacial bottom contours and remote tropical islands are perfect environments where the use of FLS and crowd sharing of bathymetric data makes the most sense. The FLS ‘ship centric’ approach allows vessel operators to anticipate and avoid danger while simultaneously filling in the sounding voids left by early explorers.
Ship-centric local history mapping
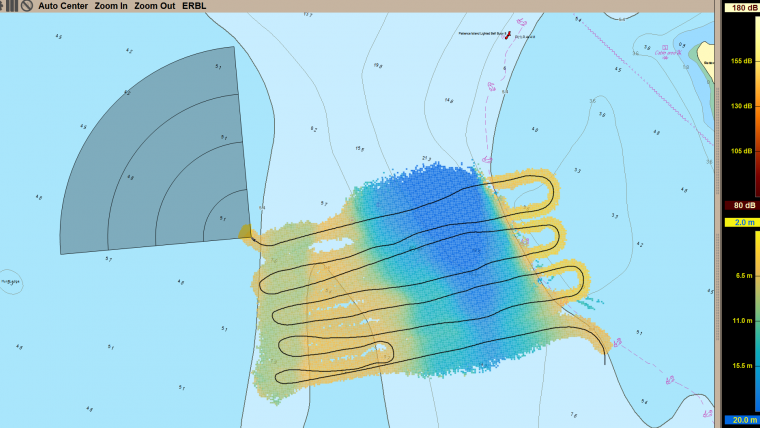
In March 2017, FarSounder will officially release SonaSoft 3.3 software that creates a 3D chart (while underway). This Local History Mapping (LHM) capability allows the FLS navigator to ’paint’ an intuitive 3D image of the bottom contour and potential obstructions ahead of their vessel in real-time. Future software releases will add additional database functionality including storage, sharing and accessing each additional visit to the area. Sea trials were conducted by FarSounder in late 2016 using SonaSoft 3.3. Figure 1 captures the FarSounder sonar survey. FarSounder 500 and FarSounder 1000 products have a Bottom Mapping Range of 8 times the water depth below the transducer. For example, in-water depth of 20 metres has a Bottom Mapping Range of 8 X 20 or 160 metres (forward of the sonar). Depending on the local propagation conditions and the seafloor composition, this range may be longer or shorter.
All other targets that are outside the Bottom Mapping Range but appear on the sonar image are called ‘In-water Targets’ (Figure 2). The sonar cannot discriminate between in-water targets that are on the seafloor, in the water column or floating near the surface. The in-water target image will change colour and correct its position on the chart as the vessel gets within the sonar’s Bottom Mapping Range. The standard FarSounder user interface software includes automated alarms, GPS compass, depth sounder display and vector-based chart plotting capabilities (Figure 3).
A gross quantitative analysis was made by FarSounder between the 2016 Local History Map and NOAA survey H11988 (2008/2009) multibeam data. In the analysis, FarSounder used a Furuno SC-30 GPS compass for position, course over ground, speed over ground and rate of turn. No compensations were made for heave. The orientations of the Transducer Module and SC-30 were eyeballed. An iso-velocity sound speed of 1,500 metres/second was assumed for all depths for simplicity. Since this was a location with relatively little tidal change, a single tide height was averaged over the time of the survey. When considering the entire survey, the depth measurements had an average depth difference of 3.31% relative to the NOAA data with a standard deviation of 2.40%. As the software continues to be developed to include more hydrographic parameters, such as tide height, the quality of the 3D surveys will also improve.
Game changers
A data sharing revolution is taking place at sea. Whether it is the adventure cruise ship operator creating their own 3D survey of a secluded anchorage or the resource strapped government surveyor expanding the list of trusted sources of data, there is no question, the quality and quantity of hydrographic data that is being collected by mariners is impressive. This all contributes to changing the hydrographic data paradigm. The days of using single point fathometers for depth soundings are fading. Whole area bottom contour maps are being produced by individual mariners in remote areas with the latest technology.
With the capabilities mentioned in this article, individuals could produce a survey that resembles the International Hydrographic Organization Order 1a/1b hydrographic survey with no extra specialized sonar system. Crowd sharing of this and other relevant navigation data allows mariners to help other mariners in time of need. The implications of this are endless. Post-disaster humanitarian aid might have reached ports such as Port au Prince, Haiti much earlier and recovery operations in coastal areas near Fukushima, Japan might have resumed sooner, had there been assets in the area sharing 3D data. As sonar technology/software and crowdsourcing applications mature hydrographic data contributors have begun to multiply and contribute to the subsurface puzzle in the sea less travelled.
Acknowledgements
The author would like to thank Matthew Zimmerman (Vice President of Engineering at FarSounder) for the data, information and image contributions.
More Information

Value staying current with hydrography?
Stay on the map with our expertly curated newsletters.
We provide educational insights, industry updates, and inspiring stories from the world of hydrography to help you learn, grow, and navigate your field with confidence. Don't miss out - subscribe today and ensure you're always informed, educated, and inspired by the latest in hydrographic technology and research.
Choose your newsletter(s)


