Hydrographic Surveying in the Port of London
Charting for the 21st Century
By the end of this year, the gap will have finally closed on the mandatory requirements for ships to carry an Electronic Chart Display and Information System (ECDIS), with all existing vessels of over 10,000GT being required to be so equipped (all new vessels greater than 3,000GT already have to comply). This article explores the provision of the chart data for the Electronic Navigation Charts (ENC) available to such systems and how the UK's Port of London Authority (PLA), as a major port, is providing such data.
This article has been brought to you by Teledyne CARIS
To survey the 400 sq. miles (1,000 sq. km) of river and estuary, from above Richmond right out to the North Sea and supply data for the pilots, mariners, engineers and environmentalists, the PLA Hydrographic Service have three purpose-built survey boats, at 18m, 14m and 8m in length and a team of 17 people, producing over 300 surveys a year. All three boats are equipped with top-of-the-range multibeam systems (Reson 8125, 7125 and R2Sonic 2024), coupled with Applanix PosMV motion sensors. An added Applanix LANDMark laser system can be moved from boat to boat as required. All surveys are performed to a standard which exceeds IHO Special Order.
The PLA further operates a system of 16 remote tide gauges throughout its area, for whilst most of the depth reduction for survey work is now done by post-processing kinematic dGNSS, the pilots and mariners still rely on tide observations. Another reason to keep the tide gauges is to allow unbroken records for historical monitoring and analysis. With over 19 years of digital tide information this allows the PLA to produce very detailed harmonic components for use in prediction engines. The tidal data are available through Vessel Traffic Services (VTS) and on the Portable Pilot Units (PPUs) via the Automatic Identification System (AIS).
Acquisition and initial processing of the survey data is done using Hypack software, with the final cleaning and selection of soundings in Fledermaus. Typically, a 1m Bathymetric Attributed Grid (BAG) is exported from Fledermaus and loaded into a CARIS Bathy DataBASE for archiving (with over 1900 surveys now in the Database). The critical area BAGs are turned into a Bathy ENCs using BASE Editor. Time from completion of the sounding work to the bathy ENC being available is often as little as two days.
ECDIS Benefits and Challenges
There is no doubt that having one’s position continually displayed on the chart is a tremendous advantage to the navigator or pilot. ECDIS can give much more than just displaying the vessel position (and those of other vessels) on the chart, there are safety zones which are automatically sensitive to the vessel draught and safety contours, which can be set to define areas where there is sufficient water to navigate.
The problem that Hydrographic Offices have had over the last few years is creating the Electronic Navigational Charts (ENC) that are the official data that feed the ECDIS. To avoid the massive overhead in recompiling World folios of charts and having to maintain two products (paper and digital), most Hydrographic Offices (HOs) have opted to use the paper product as the base dataset. This severely limits the efficacy of the ENC in ECDIS, in particular the safety contour as only limited depth information is present on the original paper chart and thus in the digitised ENC product. The United Kingdom Hydrographic Office (UKHO) is only now starting with a ‘digital first’ policy to integrate the high-resolution survey data that is available into their ENCs thus allowing the ECDIS to be used to its full capacity with highly detailed safety contours.
Port Authorities and the ENC
There are two ways in which a well-resourced port hydrographic service such as that of the PLA can fill this gap. Firstly, highly accurate bathymetry from the most recent survey can be compiled into a Bathymetric ENC (bENC), in the case of the PLA the approach channels and berth approaches are now all covered at 0.5m contour interval.
Second, all ports in the United Kingdom are obliged to supply survey data to the UKHO for incorporation into the official charts. However, the production process of the UKHO still incurs delays and loss of detail.
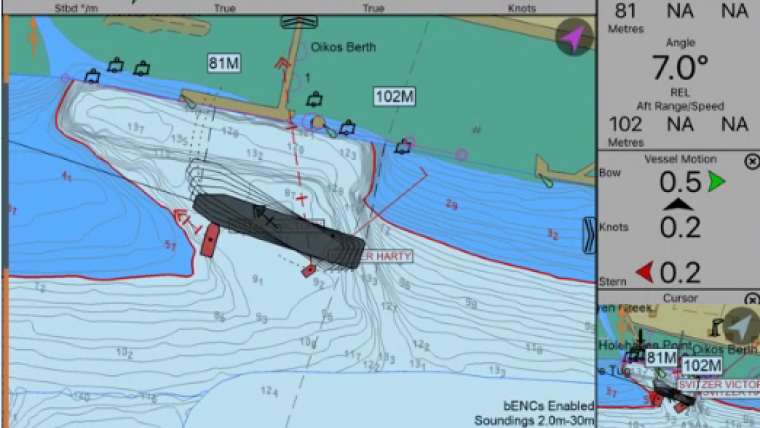
As already mentioned, the only charts approved for use on ECDIS are those issued by the national authority, in the case of the UK, the UKHO. The highly accurate survey data could be of great use to vessels entering the port of London. However, ECDIS regulations prevent use of ‘unofficial’ data, so for the time being the detailed bathymetry is only available on pilot systems (Figure 1). The Portable Pilot Units (PPUs) that the pilots now carry can display this data over the underlying official (but smaller scale) charts. An example is shown in Figure 2, where the official chart only has a 15m contour, so the channel is effectively closed to the ship requiring a safety contour of 14.0m. The PLA ‘cell’ shows the safety contour of 14.0m. Navigators know this and ignore the ‘official’ screen, which is not exactly conducive to safety. The PLA has been producing berthing scale electronic charts for the PPUs for some time but has now come to an agreement with the UKHO that the latter will publish the PLA charts verbatim, so they will be available to international shipping for use on their own ECDIS, this is a first for a UK (and one suspects, European) port.
The PPUs are now offering sub-metre accuracy via the use of RTK dGNSS. The entire bridge team need to rely on this, whether it is a 400m container ship turning in a very limited area or a passenger ship squeezing through the Thames Barrier (Figure 3). This has put the onus on port surveyors to ensure that the topography is equally accurate. Over the last ten years the PLA Hydrographic team have been using laser systems and aerial photography from drones, in addition to the multibeams, to capture every last detail of the structures above and below the waterline. This data have been included in the ENC data as well (Figure 4).
Future Charting
So, where does this leave the PLA Hydrographic Service for the future in charting? The beauty about the way the ENC is set up, is that layers can be turned on and off. Whilst the current S-57 product specification is very restrictive in this respect, the new S-100 ENC specification solves many of the current issues. Once accepted into the maritime world S-100, based on international geospatial standards from the common ISO series used in Geographic Information Systems (GIS) as well, will allow the use of additional overlays (Figure 5), This will include high-resolution bathymetry, temporal data (e.g. Meteorological and tides), port information, nautical publications, photographs etc.
Continued investment in the latest technology and competent surveyors and crew has enabled the Port of London Hydrographic service to not only meet the increasingly stringent demands for safety of navigation surveys, but also offer high-resolution bathymetry to many other stakeholders interested in the waterway that flows through England’s capital city (the Thames), much of it on a commercial basis.

Value staying current with hydrography?
Stay on the map with our expertly curated newsletters.
We provide educational insights, industry updates, and inspiring stories from the world of hydrography to help you learn, grow, and navigate your field with confidence. Don't miss out - subscribe today and ensure you're always informed, educated, and inspired by the latest in hydrographic technology and research.
Choose your newsletter(s)


