Charting the Data
Development of the Radio-acoustic Ranging Navigation Technique (Part 2)
Radio-acoustic-ranging (RAR) navigation, developed within the US Coast and Geodetic Survey, was the very first survey-quality navigation system that did not need to see fixed, known objects on land for inshore piloting navigation or astronomical bodies for celestial navigation. This is the second in a series of two History features on the development of the technique. In the feature, we read why RAR should be remembered as a major step forward in the development of electronic navigation systems, as a forerunner of many modern oceanographic telemetering systems and as a stepping-stone on the path to marine seismic surveys.
As noted in Part 1, radio-acoustic ranging (RAR) was developed as an outgrowth of early 20th century acoustic research, in particular those avenues related to both navigational safety and military applications. With the advent of acoustic depth-measuring devices, it immediately occurred to navigators and hydrographers alike that accurate bottom maps could provide a means to navigate surface vessels equipped with continuously operating depth-finding instruments. This concept was stated succinctly in the 1925 Annual Report of the Coast and Geodetic Survey (C&GS): ‘Their general use in navigation necessitates the early increase in detailed hydrographic work to develop more closely the character of the bottom. As the aviator can tell his approximate location by the terrain over which he is flying, so characteristic submerged valleys, peaks, plateaus, etc., will serve as landmarks to the navigator.' To bring this concept to fruition, the US C&GS, following its development of RAR, embarked on an ambitious programme to survey all approaches to US ports with sufficient accuracy and sounding density to provide mariners with the means to use bathymetric navigation for finding their way to port regardless of weather and visibility conditions. These surveys were carried out past the 1,000-fathom isobath and in many areas even out past the 2,000-fathom isobath. For the first time, the continental shelf and slope of widespread areas were surveyed to unprecedented levels of positioning accuracy and at unprecedented levels of sounding density.
The continental shelves and slopes of the entire West Coast of the USA, the northern half of the East Coast of the USA, the Gulf Coast out to 100 fathoms and widespread areas of offshore Alaska were surveyed with these new technologies and this new concept of defining the configuration of the deep sea floor for navigational purposes and not necessarily for discovering hazards to navigation. The first of these surveys was conducted in 1925 off the coast of Oregon. Over the next 15 years, every major ship of the C&GS including the Guide, Pioneer, Discoverer, Surveyor, Hydrographer, Oceanographer and Lydonia were engaged in this effort.
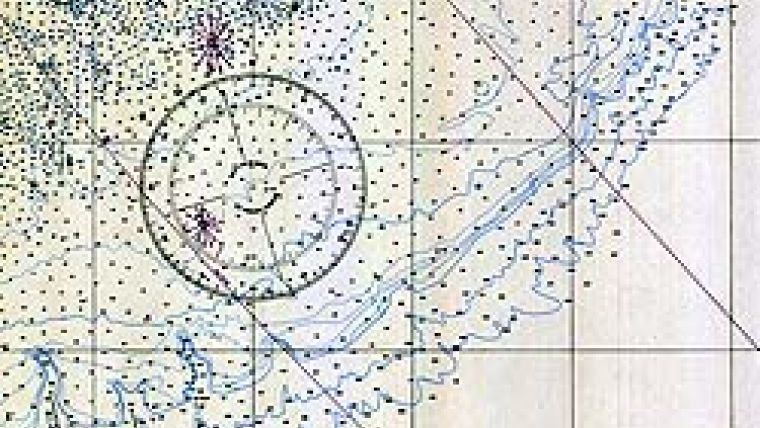
By the eve of the Second World War, thousands of deep-water offshore soundings had made their way to the charts. However, with the exception of the use of the canyons seaward of the Georges Bank area of New England, there is little evidence that mariners used this explosion of depth information to better navigate their ships. Part of the problem was the nature of the charts themselves. Initially, the bathymetric information was added in the form of numbers denoting depths with insufficient contours to actually interpret the nature of the sea floor. This made it difficult to compare depth profiles obtained while underway to the charted depths.
To mitigate this, in 1939 the C&GS produced an experimental chart, Chart 5101-A, San Diego to Santa Rosa Island. This chart encompassed much of what is now called the Southern California Borderlands, an area noted for deep basins interspersed with a series of banks and linear ridges. This new type of chart used far fewer depths than the traditional chart of the area and relied instead on blue-tinted contours at 50-fathom intervals to show the offshore bottom configuration. Inshore the chart retained the traditional contours and colour pattern to indicate proximity to shoal water and the shoreline. The follow-on West Coast series of charts extending to Cape Flattery (WA), produced between 1940 and the late 1940s, used 100-fathom contours, which lessened the visual effect of the contours. Thus, Chart 5101-A and its follow-on editions were perhaps the most beautiful of this new genre of charts.
Because of the very wide continental shelf on the East Coast and Gulf Coast of the USA, the contour interval for these charts differed from the offshore West Coast charts and from chart to chart. Starting in the Gulf of Maine, the 1944 edition of Chart 1106, Bay of Fundy to Cape Cod, had 10-fathom contours out to 160 fathoms, the deepest depth on the chart. The 1945 edition of Chart 1107, Georges Bank and Nantucket Shoals, had 10-fathom contours out to 100 fathoms, beyond which it used 500- and 1,000-fathom contours. This chart was particularly important as Corsair, Lydonia, Oceanographer and Hydrographer canyons all served as underwater landmarks for navigators making their way from northern Europe to New York.
Perhaps the most striking of East Coast charts of this period was the 1944 edition of Chart 1108, Approaches to New York. This chart followed the same contour scheme as Chart 1107 but encompassed the majestic Hudson Canyon, which pointed the way to New York Harbor. The next chart of the series, Chart 1108, Cape May to Cape Hatteras, reverted to 10-fathom contours out to 50 fathoms, and beyond this 100-, 500-, and 1,000-fathom black-tinted contours. This chart was significant for including Baltimore and Wilmington canyons, which served as markers pointing the way to Delaware Bay and Norfolk Canyon off the entrance to Chesapeake Bay. Because of the somewhat amorphous bathymetry of the Gulf Coast continental shelf, there were few features that could serve as navigational markers. However, a plethora of offshore salt domes were discovered, a precursor to the discovery of oil and natural gas off the shores of Louisiana and Texas. The first chart to show the location of many of these economically significant features was the 1939 edition of Chart 1116, Mississippi River to Galveston.
The greatest contribution of RAR when used in concert with echo-sounding was perhaps to increase our understanding of the true nature of the sea floor and our planet. The 1937 US National Academy of Sciences report entitled International Aspects of Oceanography by T. Wayland Vaughan stated: ‘... the invention of radio-acoustic position finding and the invention of echosounding has made possible the recognition of minutiae of sea-bottom configuration that was entirely impossible only a few years ago.' Over the 15 years or so of widespread use of RAR by the C&GS, the unique configuration of the southern California continental borderlands was determined; sea mounts such as Davidson, Guide, Pioneer and Rodriquez were discovered and surveyed to previously unprecedented levels of accuracy and resolution; at least 10 large canyons were discovered on the East and West Coasts; the eastern terminus of the Mendocino Escarpment off northern California was discovered and surveyed, pointing the way to the discovery of its western extension, the Mendocino Fracture Zone, two decades later; and numerous salt domes were discovered and surveyed in the Gulf of Mexico, including Flower Garden Banks, which are now designated a National Marine Sanctuary.
With the coming of the Second World War and the invention of various forms of electronic navigation, RAR rapidly passed from the realm of the hydrographer. The elimination of the need to carry explosives on a survey ship, the relative ease with which electronic stations could be installed compared with RAR hydrophone stations, and the higher accuracy and precision of the new electronic systems all combined to spell the demise of RAR. Its legacy included an improved understanding of the nature of continental margins, discovery of numerous previously unsuspected undersea features and a better understanding of the velocity structure of the oceanic water column. Many technological improvements were made during the course of RAR development, not least of which was the invention of the radio-sonobuoy, a forerunner of virtually all modern telemetering oceanographic buoys. The offshore charts of today's US National Oceanic and Atmospheric Administration Office of Coast Survey still carry vestiges of this early effort to survey the continental shelf and slope of the USA and oftentimes carry the exact choice of contour intervals selected 60 to 70 years ago in response to the then young technologies of RAR and acoustic depth measurement.

Value staying current with hydrography?
Stay on the map with our expertly curated newsletters.
We provide educational insights, industry updates, and inspiring stories from the world of hydrography to help you learn, grow, and navigate your field with confidence. Don't miss out - subscribe today and ensure you're always informed, educated, and inspired by the latest in hydrographic technology and research.
Choose your newsletter(s)


