Crowdsourcing for Hydrographic Data
A Tool for Updating Nautical Charts
Approximately 50% of the sounding data shown on US NOAA nautical charts is pre-1940, collected by antiquated lead-line soundings and wire drags. Even the 500,000 square nautical miles of the most navigationally significant EEZ waters would require 167 years to survey. Crowdsourced data can significantly augment authoritative geodata bases and provide answers to critical mapping deficiencies. The challenge in the marine geospatial sector is to ensure the reliability of crowdsourced data by managing and structuring the process to ensure that it can be confidently relied upon as useable and accurate. SURVICE Engineering and CARIS have developed the ARGUS system as one such reliable process.
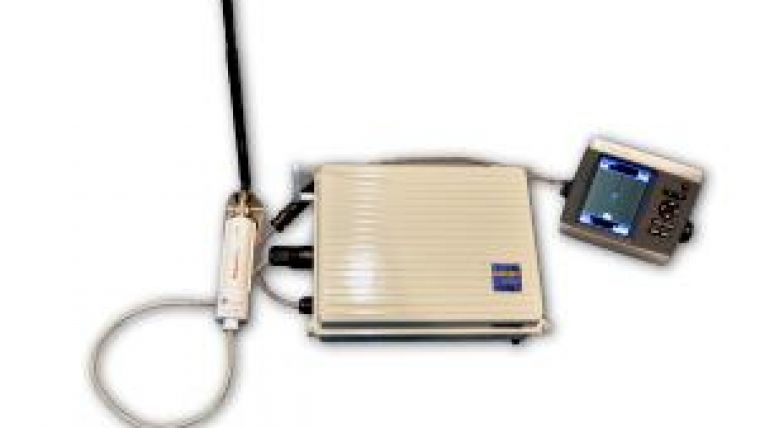
The ARGUS system provides automated acquisition and processing of crowdsourced bathymetry. ARGUS consists of a compact automated onboard unit as shown in Figure 1, designed to universally interface with and process the outputs of a vessel’s navigation and depth systems and port this output to a central server. Hydrographic and statistical processing modules facilitate quality control, calibration and error corrections, and filtering for application to a wide range of temporal and spatial interests. SURVICE works with CARIS on application of the processing modules, which include use of CARIS Bathy DataBASE (BDB) and Spatial Fusion Enterprise (SFE). The ARGUS Crowdsourced BDB (ARGUS CS-BDB) provides near real-time feedback via web access to the processed incoming data and to the continuous solution sets generated from all participating vessels.
Originally demonstrated through a National Oceanic and Atmospheric Administration (NOAA) research grant, ARGUS CS-BDB has been in use since 2008 in the United States and has processed nearly 40 million soundings from recreational and commercial vessels. Participating vessels now range from 6m high-speed fishing boats to 300m commercial cruise liners, all of which operate without regard for the hardware or for a bathymetry mission. Once installed, the system uses shore-based wireless access points, cellular networks, or the vessel’s existing broadband connection to automatically offload data; and uses the same connection to provide PC access to the CARIS SFE server for the processed data and visualisations. As demonstrated in Figure 2, the SFE outputs are overlaid onto available nautical charts so the vessel crew and other data users can quickly identify areas where the charted data is not consistent with the most recent solutions of the ARGUS CS-BDB system.
Ongoing ARGUS CS-BDB developments include process and throughput sharing for weather and water quality environmental data, as well as onboard systems and vessel dynamics monitoring. The bathymetric correction process continues to evolve and will also take advantage of these and other external inputs.
Uncertainties
Current chartplotter technology used by professional mariners and recreational boaters is well suited to providing crowdsourced bathymetry. Typically a GPS receiver using standalone positioning has an uncertainty of +/- 10m @ 95% confidence. This uncertainty can be reduced to +/- 3 to 5m @ 95% confidence if using DGPS or WAAS corrections. GPS to transducer offsets greater than 3 metres must also be accounted for in the positioning of soundings or they will significantly contribute to the Total Horizontal Uncertainty (THU).
A reasonable assumption for the depth sounder or fish finder measurement uncertainty is +/- 0.1m. Most boat operators will know the vertical offset between their fish finder transducer and the waterline within +/- 0.3m. Position and depth errors resulting from roll and pitch can be ignored as long as the GPS antenna is not extremely high and motion does not significantly exceed the half angle of the transducer beamwidth. But it is far more difficult to determine tide and sound speed uncertainties for calculating the Total Vertical Uncertainty (TVU) without evaluating a specific geographic area.
Charlotte Harbour
Figure 3 indicates the case study area in the vicinity of Charlotte Harbour, Florida and the ARGUS data downloaded from the website for South Florida. This dataset was current through 20 October 2011, was not corrected for tides, and sound speed was assumed to be 1500m/sec. The maximum diurnal tidal range for this area was about 0.62m at North Captiva Island. According to the US Navy’s Generalized Digital Environmental Model (GDEM), water column sound speed for this area varies between 1520 – 1545m/sec. The THU and TVU of this dataset, therefore, are expected to be about 10.8m and 0.8m respectively. This was a sparse dataset that precluded the use of data dense statistical methods to evaluate reliability. Instead, a comparison was made of the ARGUS data to the most recent survey data for the area.
This area was last surveyed by NOAA’s predecessor, the US Coast and Geodetic Survey (USC&GS), between 1956 and 1960. Figure 3 also depicts the USC&GS H-sheet (smooth sheet) coverage of the Charlotte Harbour area overlaid with ARGUS depth data. Table 1 summarises the USC&GS data used in this case study. The horizontal and vertical datums used were North America 1927 and Mean Low Water. All soundings were corrected for sound speed using bar checks and for tides. Due to the positioning uncertainty of shore control used in sextant signals, the large uncertainty of SHORAN fixes (minimum 30m drms) and other conversion issues, the THU of the soundings published on the current NOAA chart products of the Charlotte Harbour area is estimated to be between 20 – 65m.
| Survey
| Year
| Scale
| Position. System
| Depth Sounder
|
| H08193
| 1956
| 1:10,000
| Sextant
| 808-J Fathometer
|
| H08194
| 1956 - 1957
| 1:10,000
| Sextant
| 808-J Fathometer and EDO 255
|
| H08195
| 1959 - 1960
| 1:10,000
| Sextant
| 808-J Fathometer
|
| H08196
| 1956 & 1959
| 1:20,000
| SHORAN
| 808-J Fathometer and EDO 255
|
| H08358
| 1956 - 1957
| 1:10,000
| Sextant
| 808-J Fathometer and EDO 255
|
The USC&GS vertical standard of that era was 0.3m allowable error for 0 – 20 metre depths. This standard was for measured depths and did not include tide and dynamic draft corrections. The chart datum then in use was Mean Low Water (MLW) based on National Tidal Datum Epoch (NTDE) 1941 – 1959, whereas today the chart datum is Mean Lower Low Water (MLLW) based on NTDE 1981 – 2000. It so happens that due to sea level rise, MLW of the old epoch corresponds closely to MLLW of the current epoch in this geographic area. In conclusion, it is reasonable to assume that the TVU of the USC&GS depths in these surveys would have met the current IHO S-44 5th edition standards for Order 1B.
A comparison was made of the ARGUS data, in CARIS CSAR format for South Florida, and the NOAA digital hydrographic data in HYD93 format using CARIS BathyDataBase. Figure 4 is an example of a TIN surface model that was created for each USC&GS H-sheet and the difference layer for the overlapping ARGUS data. Figure 5 is an example of a bar graph produced for each H-sheet area for Argus data minus the corresponding TIN surface model at 0.3m bins.
Results
Table 2 (below) summarises the results of these analyses. The comparison of ARGUS data with the five USC&GS H-sheets indicates an overall mean difference of 0.0m with a standard deviation of +/- 0.5 metres which is consistent with the estimated THU of 0.8m for a chartplotter system. Localised biases in the ARGUS data were present and were probably due to the effects of tides, sound speed variation and vertical offset error. Higher standard deviations for ARGUS data in some H-sheet areas were probably due to positional inaccuracies in high relief areas and motion errors due to higher sea state.
Future Work
• Include horizontal offsets between the GPS antenna and the transducer in the processing calculations.
• Encourage the use of WAAS and DGPS positioning instead of standard GPS positioning.
• Use the US Navy Global Digital Environmental Model (GDEM) or a similar worldwide model to correct for sound speed.
• Investigate the value of correcting GDEM profiles with measured water temperatures from ARGUS-equipped vessels which have a thermistor at the transducer.
• Investigate the most cost-effective ways to correct for tides from operating NOAA or other tide stations and from historical tide prediction stations.
• Simultaneously obtain bathymetric data from a hydrographic survey suite and a commonly used chartplotter to analyse depth variances and to determine their significance for charted depths.
Conclusions
Combined with a constant supply of data from an unlimited crowdsourcing workforce and the steady progression of sensing system capabilities, the evolving ARGUS solution sets will continuously approach higher order industry standards. In the meantime, ARGUS CS-BDB provides access to remote waterways that have not been surveyed in decades as well as continuous, ongoing surveys for those areas well-travelled. This added value to international hydrographic interests comes at a fraction of traditional surveying costs and will increasingly improve safety and limit environmental risk.
Acknowledgements
Thanks are due to Paul Cooper of CARIS USA for technical input and encouragement for this article.
| Survey
| H08193
| H08194
| H08195
| H08196
| H08358
| Weighted Means
|
| Mean Diff. (m)
| 1.2
| -0.1
| 0.3
| -0.8
| -0.8
| 0.0
|
| Std_dev (m)
| 0.5
| 0.4
| 0.5
| 0.3
| 1.7
| 0.5
|
| Total Soundings
| 933
| 2,776
| 1,985
| 1,130
| 645
| 7469.0
|
@
Further Reading
• Casey, Michael J., 2009. Citizen Mapping and Charting (parts 1 & 2), Hydro International, Oct 2009, Vol. 13, No. 8; (part 3), Dec 2009, Vol. 13, No.10.
• Hydrographic Services Review Panel, 2010. Most Wanted Hydrographic Services Improvements, Federal Advisory Committee Update Report 2010, USDOC/NOA/NOS
• Jeffers, Karl B., 1960. Hydrographic Manual Pub. 20-2, USDOC/Coast and Geodetic Survey.
• SURVICE Engineering ARGUS website, http://argus.survice.com/ .
• Thornton, Tim, 2011. Team Surv – Surveying with the Crowd, Hydro International , Jul-Aug 2011, Vol. 15, No. 4.

Value staying current with hydrography?
Stay on the map with our expertly curated newsletters.
We provide educational insights, industry updates, and inspiring stories from the world of hydrography to help you learn, grow, and navigate your field with confidence. Don't miss out - subscribe today and ensure you're always informed, educated, and inspired by the latest in hydrographic technology and research.
Choose your newsletter(s)


