Expanding the Use of Survey Data to the Wider Business Community
Challenges Facing the Data Managers/Owners
The combination of technical advances in survey sensors, combined with the use of geographic information systems (GIS) and centralised data storage, has revolutionised the way in which digital survey data is acquired and managed. The result of these changes is the availability of the data to an entirely new set of users. The ease with which datasets can be selected, combined and displayed together has added genuine value to our data, and when we consider the additional decisions and business benefits that can be made from a single set of marine survey data, it has in one sense reduced the overall cost of data acquisition.
While the benefits of this are clear, a new set of problems for both the modern surveyor and data manager is also brought into play. This is because while the GIS application allows the user to combine datasets it does not guarantee compatibility in a geodetic sense or guarantee that the data is being displayed at a scale or manner that is appropriate for the decisions being made. This paper looks at some of the challenges we need to overcome to allow all users to utilise the data correctly, as well as some of the potential errors that can be made when not considering fundamental survey principles.
Mapping Techniques
The processing power of the standard user’s desktop PC means that the corporate dataset is now more widely accessible, thus where charts or maps used to be produced by qualified surveyors for use by other disciplines, these drawings can now be produced ‘on-the-fly’ by the majority of users, often with very little knowledge or understanding of survey practices and techniques.
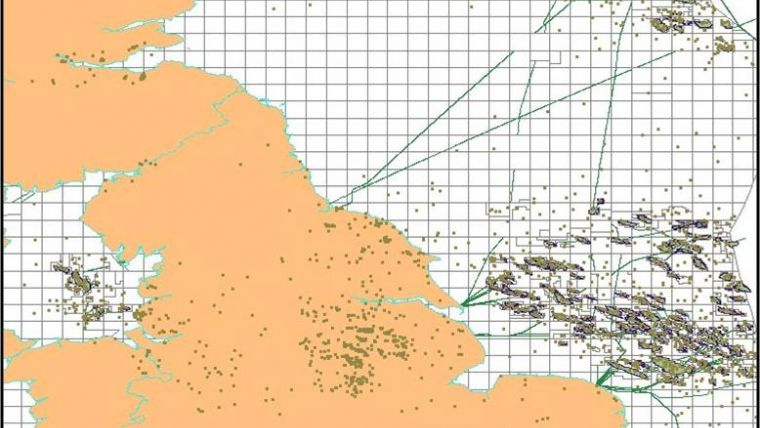
Figure 1 shows the type of map that can be easily produced with a free-to-download GIS application that allows the import of freely available data from the UK Government online data store. The GIS application itself cannot be faulted as it allows ‘on-the-fly’ transformations which are necessary, as even from a common data store, the data had been recorded with different Geodetic parameters. While the application correctly warned the user that a transformation was required when importing a specific dataset, the user simply had to press ‘Yes’ to allow the data import process to be completed. No obvious indication was provided as to what the transformation process was or what parameters would be applied. The application developer has to provide this functionality to ensure the system is flexible, therefore the fault, if there is one, potentially lies with the user, who needs to adequately understand the ramifications of misapplication of the datasets. Often, if unsure, users simply press ‘Yes’ and judge the accuracy of the map on the premise that it ‘looks right’. In this example, the scale of the resultant map means that no accurate measurements could be made, however, the ability to easily zoom in and show the digital data at smaller scales opens up the distinct possibility that uninformed users will make decisions on incorrectly aligned data or display data at scales inappropriate to its acquisition.
Historical Training
Historically, training provided by surveyors has focused on the intricacies of the discipline and the theory of computations on the complex mathematical shape that we inhabit. This perhaps was aimed more at job protection rather than educating the users and is an area that needs addressing. The challenge the surveying community faces involves a re-evaluation of the type of training provided to users. It is not simply enough to explain the rudimentary principles and a demonstration of why datums, ellipsoids and projections are necessary. The training also needs to help a user, who will typically have a different technical background, understand and recognise the potential pitfalls that are relevant to their particular business activity. The majority of GIS applications handle geodetic issues very well and for the majority of users the geodetic parameters peculiar to their operations are normally clearly defined. The biggest potential for error is perhaps the user either not recognising the type of data they are importing into the mapping model, or assuming that it is in the format that they would like. With modern surveys the data generally includes good metadata and the acquisition parameters are well defined. This is not the case with historical datasets where the metadata is either missing or simply wrong. In these cases the user generally makes an assumption that the data is in the format that they are expecting. In addition to disparate geodetic parameters, another issue can often be a lack of understanding of how an application actually manages a dataset and the users make the assumption that the system will correctly transform the data.
Effects on Data Presentation
An example of how a simple survey misunderstanding can have a dramatic effect on the data presentation can be seen in the position of a deviated well. From a surveyors perspective, the deviated drilled well is unique in that there are no redundant measurements during the survey and error checking relies on external data sources such as geological measurements. Figure 2 shows how any errors in the data will have an effect on the next and subsequent positions. The import function of the majority of GIS applications is a fairly automated process, the premise being that the data has already gone through a QC check and the application is simply displaying the approved data. It is not unknown for fairly large errors in data manipulation to go unnoticed. Another area of potential error is in either the lack, or poor quality, of metadata, especially in relation to the measurement units. A frequent issue that appears with historical data, is the requirement for the user to be familiar with the original well design in order to be able detect if the depth measurements are in feet or metres.
The following example has been reproduced from its original location using Geodetic parameters chosen to emulate the magnitude of the error rather than indicate actual position.
In deriving the position of a deviated well the following three measurements are made at various locations along the well trajectory.
- Measured Depth (MD) or distance down the well.
- Azimuth (Az) or direction of the well path.
- Inclination (Inc) from the vertical of the well path.
The location of these measurement points, known as survey stations, are selected so that they reflect the changes in direction of the wellbore in both the horizontal and vertical planes.
In this particular example, the well ran approximately east to west extending over a horizontal distance of approximately 1.1km to a target depth of 1.8km. The dataset was based on the European Datum 1950 (ED50) with a Universal Transverse Mercator Projection with Central Meridian 3°E.
|
Datum |
European 1950 |
|
|||||||
|
Projection |
UTM 3°E |
|
|||||||
|
Ellipsoid |
International 1924 |
|
|||||||
|
Top Hole Position |
Latitude |
55° 30’ 00” N |
Longitude |
001° 20’ 00” E |
|
||||
|
Easting |
394715.8 mE |
Northing |
6151830.1 mN |
|
|||||
|
Convergence |
-1.374° |
|
|
|
|||||
|
Station |
MD |
Inclination |
Grid Azimuth |
|
|
|
|||
|
(Feet) |
(Degrees) |
(Degrees) |
|
|
|
||||
|
1 |
0.0 |
0.00 |
268.6 |
|
|
|
|||
|
2 |
362.0 |
0.00 |
268.6 |
|
|
|
|||
|
3 |
443.8 |
0.30 |
84.67 |
|
|
|
|||
|
|
|
|
|
|
|
||||
|
440 |
7782.0 |
15.99 |
58.01 |
|
|
|
|||
|
441 |
7890.0 |
15.99 |
58.01 |
|
|
|
|||
In contrast to the Geodetic parameters for the source data, the user’s corporate database was based on a Transverse Mercator Projection, Central Meridian 0°E and so the above position was re-projected during the import of the data into the database. What the user did not recognise, however, was the effect this would have on how the GIS/Well Computation software used the data in computing the trajectory of the well. The industry standard computational algorithms use True Azimuth to compute the position of the individual survey stations. When imported into the corporate database, the system was unable to detect that the Grid Azimuths were based on the original UTM 3°E projection. The system simply applied the TM 0°E convergence to derive True Azimuths, thus introducing an error in azimuth to the order of 2.47°. Figure 3 shows the impact on the final computation of the well trajectory. The effect of the rotational error across the length of the well trajectory culminated in an error in position of approximately 50m at the Bottom Hole or target location.
Consequences
Often changes in geological formations detected and positioned during drilling operations are used to recalibrate the Seismic Velocity models. It is clear that the placement of the well in the wrong geographical position within the model would have a direct impact on these velocity calculations and hence any subsequent interpretation of the seismic datasets. It took some time for this error to be detected as the user focused on the fact that the trajectory ‘looked’ correct in the mapping applications and the top-hole location was correctly referenced in the project projection.
Conclusion
Errors such as these, while they might be obvious to the surveying community, are not immediately apparent to the wider user. Our education and training process should therefore be designed to highlight not only the potential errors and their magnitude but most importantly the potential impact on the business. If this is achieved then all users will benefit from the digital survey data we acquire.
John Kelly graduated as a land surveyor from the University of East London and initially working for J.A. Storey & Partners and Glenn Surveys. He joined Geosite Surveys in 1985 and worked in the various group offices worldwide, and was appointed survey manager for the UK. Later, he joined Hydro Projects in 1994 as a systems developer and currently holds the position of technical manager responsible for the software development division of the company as well as providing Geodetic Awareness courses for various contractors and operators.

Value staying current with hydrography?
Stay on the map with our expertly curated newsletters.
We provide educational insights, industry updates, and inspiring stories from the world of hydrography to help you learn, grow, and navigate your field with confidence. Don't miss out - subscribe today and ensure you're always informed, educated, and inspired by the latest in hydrographic technology and research.
Choose your newsletter(s)


