From Data to Information
A Conceptual View of Data Integration as the Backbone of e-Navigation
The current discussion on e-Navigation focuses on the technical implementation of integrated data streams to increase situational awareness and optimise support for decision making in two key areas: The mariner in charge on the bridge of a vessel and the marine expert on shore, for example in a VTS centre. The real goal is to enable the bridge team to make the right decisions in preparation for their voyage. Data integration for improved situational awareness provides the key to success.
As maritime transport becomes more complex, for example due to changes in ship size, increased traffic density and growing economic pressure, the decision makers on board ships and their shore-based supporters need to acquire more and better information to avoid errors.
From the viewpoint of this concept, the situation on board ships is characterised by a growing amount of data that is made available from a variety of sources, for example, static data such as ENC or publication data, dynamic data, weather data or onboard sensors. New concepts such as AIS AtoNs or tide gauge data transmission are increasing the flood of data which needs to be handled by the mariner.
On shore, the situation is similar. More and more data can be and is being collected by AIS centres and it needs to be analysed by the experts. At the same time, critical data from ships is missing or is made available too late in order to provide the ships’ decision makers with the necessary guidance.
The challenge for e-Navigation will be to combine the different data streams and compile the necessary information for those in need of knowledge and situational awareness. To be able to do this, the relevant data streams need to be defined and the data needs to be collected. From this collection of data, the relevant facts relating to a certain situation and task on hand need to be selected and then integrated and grouped to ensure that the system user is fully informed and able to make an intelligent decision.
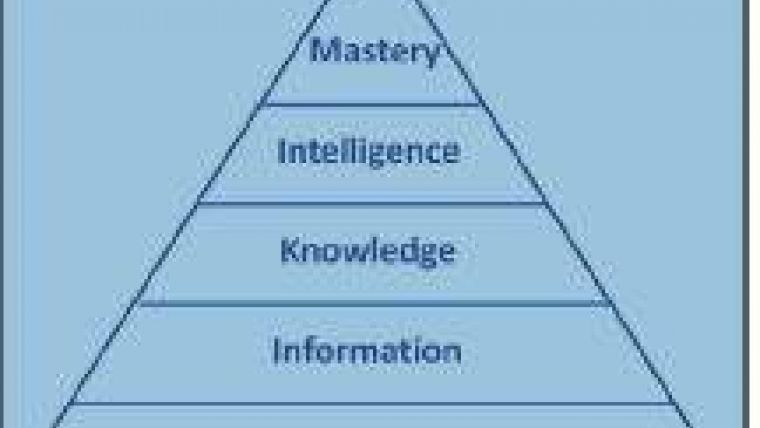
The following diagram illustrates this concept of data integration. This is common knowledge and needs to be more specifically defined towards the e-Navigation goal of mastering the task on hand when guiding and navigating ships safely and efficiently.
Two key aspects need to be dealt with, which are explained in more detail in the following paragraphs:
1. Ensure the available data is correct and up to date.
2. Create necessary rules to enable situational centric information generation.
| Data: A raw collection of facts which can exist in any form without particular meaning, sequence or usability Information: Relational groupings of integrated data which turn raw facts into useful, meaningful collections Knowledge: The sum or range of what has been perceived, discovered, or learned, which leads to familiarity, awareness, or understanding Intelligence: Combination of past, present and future knowledge that enables us to deal with new situations and to understand the consequences of decisions Mastery: Accumulated learning and intelligence that provides insight into principles and inner relationships of a system and creates new, previously non-existent understanding or capability |
Improve Data Collection
One of the essential data streams for e-Navigation is built from the classically pre-compiled static data sets, such as ENCs or publications. These data sets need robust and up to date data collection methods. The BLAST project contains prime examples of how this data collection can be improved.
BLAST (Bringing Land and Sea Together) is an INTERREG IVB project promoting maritime safety in the North Sea region, involving 17 partners from 7 countries, including government organisations, universities and private companies. The BLAST project will demonstrate the potential for improvements in maritime safety, economy, and environmental management that can result from transnational harmonisation and integration of land and sea data.
In one of the working groups, Jeppesen, Bundesamt für Seeschifffahrt und Hydrographie (BSH - Germany), Danish Maritime Safety Administration (DaMSA Farvandsvæsenet - Denmark), and the Norwegian Hydrographic Service (Statens Kartverk Sjø - Norway) collaborate on a series of BLAST activities involving the collection, processing, and use of transnational harmonised nautical information. The sequence of activities demonstrates an integrated approach to three stages in the information supply chain: the gathering, harmonised encoding, and dissemination/use of navigation information. The team is developing a demonstration prototype or dataset for each phase; when put together, the prototypes will demonstrate the use of Web technology and new IHO standards to promote harmonised information and more efficient information flows. The end result will demonstrate the integration of information from multiple sources, including hydrographic offices, coastal authorities and port authorities, into a digital routing guide as an example of the dissemination/use of integrated information.
MDCS provides a single location for the submission of information pertaining to diverse types of information. It also provides more and quicker feedback on the status and disposition of reports. The prototype currently includes selected ENCs and nautical publications, demonstrating its concept with two very different forms of information, i.e., graphical and textual information. It can easily be extended to other types of textual and visual information.
MDCS provides a visual user interface for reporting information charted in ENCs. This interface displays a graphical view of an ENC selected by a user employing a chart catalogue or geographic locator screen. The reporting screen allows the user to highlight one or more selected classes of features. For reports that do not involve specific features, coordinates can be specified using the mouse on the graphic display in this screen. This screen offers the user the option of proceeding to an online form (where further details can be provided and attachments can be uploaded) or submitting a question or making a direct report.
Similar interfaces are provided for nautical publications. Upon submission, the changes are filed as a new report which is dispatched to an editor at the appropriate agency for review and processing.
When a report or update is received, the system notifies the appropriate hydrographic office or coastal agency by e-mail. Different views are displayed to users according to their status, for example ordinary users, editors at hydrographic offices or coastal authorities and administrators. These views comprise user interface controls which allow appropriate viewing, status updates, processing and other reporting activities, depending on whether the user is an ordinary reporting user, agency editor, or administrator.
Situation Centric Information Presentation
MDCS is an example of the shore-based data collection aspect of e-Navigation. Both on shore and on board ships the collected data needs to be integrated and presented in an informative way. The current ECDIS standards allow the overlay of data on top of ENCs within defined rules, but they do not allow for the integration of data. The problem arises as more and more data streams come together, which clutter any data presentation and lead to less information being available.
A general concept for the integration of different data streams to increase situational awareness is to be developed. This development needs to result in a situational centric rendering of the different datasets needed in the situation at hand. These situational centric information presentations are already available to some degree in the non-regulated market.
Figure 4 shows an example of the implementation of this concept. The basic underlying data is static cartographic data, such as ENC Datasets. Combining these vector datasets with real-time data, such as ship’s position, traffic situation, route data and projections, adds additional valuable data.
Rendering algorithms are integrating these different data streams and creating what is called information in the ‘conceptual triangle’ above.
The system stores predefined rendering rules which allows the system to select and integrate data and convert it into the information to be displayed. Based on the selected data, rendering algorithms are applied to display this information. The result is a display which supports the situational awareness and as such the knowledge of the navigator on the bridge.
Conclusion
The implementation of e-Navigation is important, because it can help minimise the risk in maritime navigation and, as such, maritime trade in general. The concept is to be converted into a series of systems, which will provide key features in improving the safety and efficiency of navigation at sea.
It will improve the gathering, consolidation of static datasets and their timely delivery to the parties involved both on shore and on ships. In addition, it will provide a series of real-time data streams necessary to increase situational awareness. It will also facilitate the integration of the growing data streams both on ships and on shore, be they static datasets or dynamic data streams. The resulting integration information will be the ‘fuel’ for the presentation in the various e-Navigation displays. The modern, innovative technology based on the e-Nav architecture currently in development, will be the enabling tool for this concept.

Value staying current with hydrography?
Stay on the map with our expertly curated newsletters.
We provide educational insights, industry updates, and inspiring stories from the world of hydrography to help you learn, grow, and navigate your field with confidence. Don't miss out - subscribe today and ensure you're always informed, educated, and inspired by the latest in hydrographic technology and research.
Choose your newsletter(s)


