Great Potential for SAS in Hydrography
Using Synthetic Aperture Sonar as an Effective Hydrographic Survey Tool
Synthetic Aperture Sonar (SAS) has been around for over a decade but its primary purpose has been in mine detection rather than hydrographic surveying. To use SAS effectively a stable survey platform is required such as an autonomous underwater vehicle (AUV). These platforms are becoming more commonly used in hydrographic surveying and as a result the viability of SAS as a survey sensor seems a logical progression for the industry with the suggested benefit of increased data quality, better resolution and a pathway to a more modern data-centric survey deliverable.
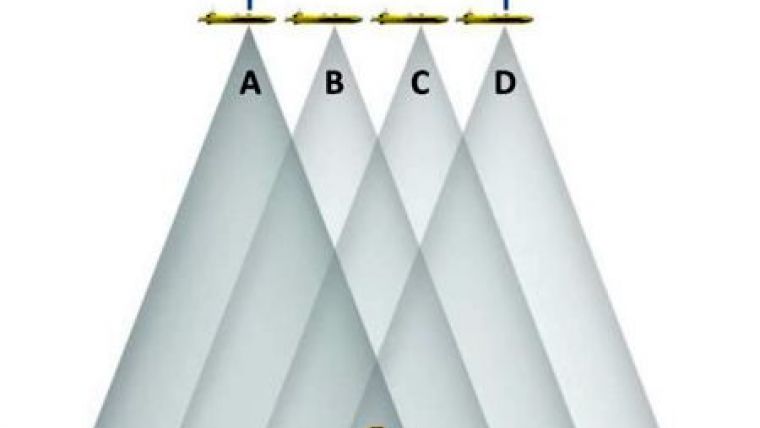
SAS is a technique for creating high-resolution seabed reflectivity images and bathymetry that shares many similarities with Synthetic Aperture Radar (SAR). The forward motion of the sonar is used to synthesise an array that is much longer than its physical length by combining multiple pings in software rather than adding more hardware as a way to gain higher resolutions. SAS uses signal processing to compare the multiple observations of the same area of seafloor to calculate its depth. See Figure 1. It also allows us to circumvent the usual trade-off between range and resolution in conventional sonar in that it provides high-quality data over the entire swath.
Although military applications, such as naval mine countermeasures, have been the major driver of development, SAS is a multi-use technology with great potential for offshore oil and gas surveying, regional surveys for charting, underwater archaeology, benthic habitat mapping and deep sea mining. Figure 2 shows an example SAS image from a sea trial conducted by the US Naval Undersea Warfare Center (NUWC), which illustrates a constant 33cm resolution to 200m range in a water depth of 27m; this constant and high resolution is a major benefit of using SAS.
In addition to reflectivity images, SAS can produce highly detailed terrain models of the seafloor by detecting the angle of arrival of seabed echoes coming from a given range grid location. In a configuration known as Interferometric SAS (InSAS), the returns from two vertically separated receive arrays are cross-correlated to measure the delay, which gives the angle of arrival that is used with the range to calculate the depth measurement. See Figure 3.
When the InSAS bathymetric resolution approaches that of the corresponding SAS image, it becomes possible to overlay the reflectivity and topography to create a true 3D representation of objects on the seabed, which is another benefit of using SAS as a hydrographic survey sensor. The ability to generate centimetre-scale resolution in all three dimensions has the potential to provide significant improvements in the detection and inspection of small seabed objects.
A third benefit is as an alternative solution to video capture and review which has been a time consuming part of pipeline inspection survey projects with remotely operated vehicles (ROVs). By using an AUV that is capable of capturing a combination of SAS imagery, bathymetry and on-demand high-definition still photography and delivering these as high-resolution co-referenced datasets there is the potential to save data review time, and provide data from the field as a GIS deliverable.
SAS Processing Considerations
In order to use this technology efficiently for hydrographic survey purposes there are a series of processing requirements and questions that need to be considered.
Sensor configuration
The locations of the arrays may present a configuration challenge as dual receivers will likely be used for InSAS systems. The correct display of the data is important if subsequent image processing, target detection and contact digitising tasks are to be efficient and accurate.
The SAS may also be accompanied by a gap filling sonar, to infill the nadir gap between port and starboard channels. These configuration aspects need to be understood in order to determine an effective line plan.
Line planning
A pipeline inspection project requires the highest resolution bathymetry, imagery and photography to be captured along the pipeline and its immediate corridor. If the AUV flew down the pipe with the SAS transducers mounted port and starboard then no imagery and bathymetry data would be captured in the area of interest. The required approach would be to fly the AUV with an optimal horizontal offset from the pipe to ensure that the pipeline is fully captured. See Figure 4.
Another consideration is that the horizontal offset may cast the far side of the pipe into shadow due to the low grazing angles needed to obtain the required resolution; this may require a second line offset on the other side of the pipe.
Unfortunately, running lines offset to the pipe does not aid the capture of still photography directly along the pipe. The need for camera or video capture could reduce the efficiency of the survey.
The resolution close to nadir of a modern narrow beam angle multibeam system would be close to that of the SAS and therefore could act as an excellent gap filler.
For a regional survey project, the aim would be to achieve the required survey order or level of accuracy with the minimum number of lines. An AUV with SAS, supplemented by a downward looking / gap filling sonar would be a highly effective mapping platform.
Navigation
SAS typically requires integration with the AUVs Inertial Navigation System (INS), in addition to a series of other surface (e.g. GPS or Wi-Fi) and sub-surface positioning methods (USBL). Once the AUV has dove the INS will provide the primary position which can be post-processed after collection to gain better accuracy.
Frame and data placement
Most SAS systems have a concept of frames or tiles of imagery and bathymetry. These datasets will likely require further manipulation in order to display the data properly in processing software.
Total depth calculation
An essential processing step is the combination of the SAS depth measurements with the AUVs depth, to get a total water column depth rather than a relative one. The AUV depth is usually determined by a pressure sensor. This depth calculation may be done at the time of collection or as a post-processing step.
Sound velocity
AUVs typically fly at an altitude of between 5 and 50m above the seafloor. In shallow-water surveys (<100m), the greater the flying height the more important it is to measure the changes in sound speed as there is more water column available for variations to occur. If the AUV is surveying in deep water (2000m) and is flying between 5 and 50m above the seafloor, then there will be less significant changes in sound speed so a sound velocity measurement at the transducer face is probably enough to ensure that the seafloor is accurately modelled.
The re-application of sound velocity is also problematic as SAS data is delivered as frames rather than range and angle data.
Local versus continuous coverage
When mine hunting with AUV mounted SAS it is normal practice to sweep the area looking for targets and then to home-in and conduct a high-resolution postage stamp survey around the target in question. However, regional or route surveys will require constant high-resolution coverage, which is much more demanding.
Data Volumes and Storage
SAS is capable of capturing very high-resolution imagery and bathymetry. These high-resolution datasets will demand lots of disk space, which is potentially problematic when considering that the SAS data is collected on an AUV that might be deployed for hours at a time. Add into the mix a gap filling sonar and the disk space requirements would get even more demanding. The time required to transfer this data from AUV disk to ship-based data storage will be greater than the time taken to acquire, therefore swappable drives are an essential part of the survey set-up allowing the data to be read directly.
Data conversion is a basic first processing step in most workflows; this would likely result in a duplicate file-set at least as large as the raw data itself. This process would also take a lot of time. When dealing with large data volumes the need for on board near real-time processing becomes quickly apparent; if data could be streamed directly into a batch process capable of applying some basic processing steps then the size of deliverable coming from the AUV would become much more manageable.
Combining datasets
A key aspect of using SAS for hydrographic surveying will be combining of port and starboard SAS data with data from the gap filling sonar. It is possible that the resolutions of these datasets may be slightly different therefore techniques like variable resolution gridding would ensure that optimal resolution is maintained in the most critical areas.
Conclusion
Through the wider use of AUVs, SAS technology seems destined to become a multi-purpose surveying tool. Its ability to combine multiple observations in software provides higher resolution reflectivity and bathymetry that is constant right across the available range. The co-registered nature of the reflectivity and bathymetry data allows for excellent feature detection, paving the way for more intuitive data inspection and quality control.
To use SAS effectively as a hydrographic sensor survey line planning is an important aspect; the use of SAS with a gap filling sonar also highlights the need for sophisticated dataset combination. Typical post-processing activities related to navigation and depth are well understood, but the requirements around motion still require investigation.
Perhaps the biggest challenge on the use of SAS in hydrographic surveying will be around data density. This will drive the need for on board near real-time data-processing resulting in the delivery of digital data products ready for analysis in GIS software.

Value staying current with hydrography?
Stay on the map with our expertly curated newsletters.
We provide educational insights, industry updates, and inspiring stories from the world of hydrography to help you learn, grow, and navigate your field with confidence. Don't miss out - subscribe today and ensure you're always informed, educated, and inspired by the latest in hydrographic technology and research.
Choose your newsletter(s)


