High-Resolution 3D Geotechnical Survey Tool
Sub-Seabed Boulders Located at Wind Farm Site
Prior to driving piles into the sub-seabed to serve as foundations for wind turbines, it is critical to ensure that the chosen locations are free from boulders and geohazards.
At a wind farm site on the Baltic Sea, previous site investigations and tunnel excavation historical records indicated that the seafloor was strewn with boulders and the stratigraphy was complex. The wind farm operator’s concern was that boulders existed in equal concentrations sub-seabed.
3D Geotechnical Survey Tool
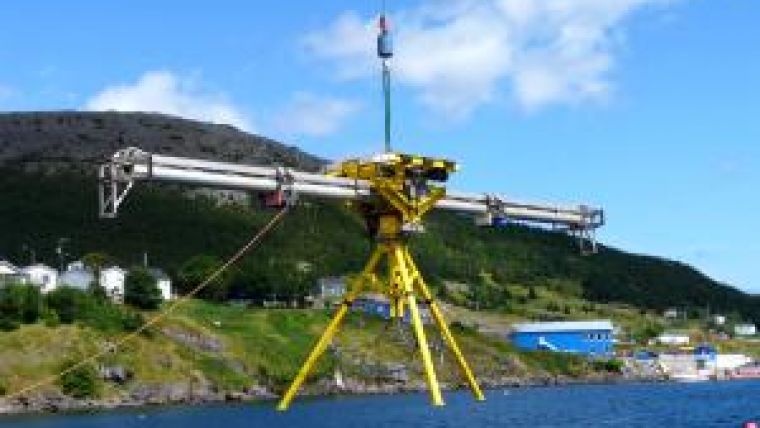
PanGeo Subsea was contracted to survey 25 potential turbine foundation sites using their Acoustic Corer (‘Corer’) to identify and locate boulders and geohazards, such as gassy soils, to a depth of 30 metres beneath the seabed. This new 3D geotechnical survey tool produces high-resolution, high-definition, multi-aspect 12-metre diameter volumetric images of the sub-seabed in real-time. Deployed to operate from a stationary position on the seabed, the unit has two scanning sonar heads, each attached to a 12-meter boom rotating 180 degrees to acquire 360 degree coverage of acoustic data. [See Figure 1] An acoustic projector / hydrophone package is located on each of the Corer’s arms. The packages acquire data as they are moved back and forth along the arms, while the arms are rotated, to produce 3D acoustic images of sub-seabed stratigraphy and geohazards. Through its multi-aspect acquisition technique, buried objects are identified through the coherent summation of up to19,800 returns from the objects’ surfaces. The image rendering method based on these summations is the key to successful anomaly identification. The Corer’s ability to locate its transducer to 1 centimetre accuracy facilitates the data integration. The data is processed using synthetic aperture algorithms to render a 3D data volume or ‘acoustic core’ representing the acoustic reflectivity of the sub-bottom. The data volumes from the survey data are manipulated in software and representative sections and slices are used in the interpretation of stratigraphy and to identify anomalies. (See Figure 2)
When the Corer is used in oil and gas applications, the detailed sub-bottom information supports pre-drilling hazard assessment, foundation zone investigations, development planning, and the identification of gassy soils, unstable slopes, buried submarine gullies and channels. It provides the information needed to de-risk a wide range of foundation placements including the placement of jack-up platforms, the driving of piles or the placement of suction anchors associated with subsea templates.
Deployment at the Wind Farm Site
At the wind farm site, the team included an offshore manager, a geoscientist, two technicians, a survey specialist and a data processor. They deployed the Corer from a 61-metre Kongsberg 500 DP 1 vessel with a 4-point mooring system located approximately 20 kilometres offshore in water depths of 14 to 20 metres. (See Figure 3) The primary source of surface positioning was a real-time kinematic (RTK) system with 1 centimetre accuracy, based at a land station, and a high-accuracy DGPS system served as a secondary positioning reference. The vessel was fitted with a Kongsberg Hi-PAP 500 Ultra Short Baseline System (USBL) for subsurface navigation of the Corer and ROV. A crane lowered the Corer, equipped with three USBL beacons, over the side. Once it was 6 metres above the intended target location, a Cougar support ROV with two manipulator arms monitored the Corer to the seabed and released the crane wire. The ROV also assisted with umbilical management, ensuring the arms could rotate freely and that the control umbilical was not caught on seabed obstructions. The vessel then moved away approximately 400 metres on the 4-point mooring system to remove the ship’s noise from the survey area. Over an 18-hour period, the Corer acquired 19,800 data points (including a set of 5,800 data points for velocity profile determination and a set of 14,000 acquired through high-frequency chirp and parametric sonar for imaging), all received by on board hydrophones and georeferenced to the centre of the Corer.
The team surveyed all 25 sites this way. The first images for each location were available on board within 10 minutes of completion of the scan. These images were used for quality control and quality assurance purposes to verify the integrity of the data. The data was transmitted to PanGeo’s St. John’s office for final processing and interpretation by a team of four geoscientists. Approximately 3 gigabytes of data were acquired in each location.
Imaging the Sub-Seabed
The Corer provides synthetic aperture sonar (SAS) processing and pre-stack seismic data processing of three distinct datasets (low-frequency chirp, high-frequency chirp, and parametric sonar).
One advantage of the chirp signal is the ability to determine the precise time of its arrival. The chirp transducer illuminates the entire seabed whereas the parametric sonar uses a tightly focused beam to illuminate a small portion of the seabed. The parametric signal forms at the seabed and spreads out from there, whereas the chirp signal spreads out from the transducer. The chirp frequency range is typically strong up to and beyond the first 20 metres into the seabed. The slightly lower frequency parametric data enhancement through SAS begins as the signal spreads and continues to target depths of up to and beyond 30 metres.
Strong signal-to-noise performance and signal-to-reverberation ratios enable the system to discriminate faint acoustic signatures from the energy reflected from variations in the seabed. The strong focusing aspect of both technologies, (high-frequency chirp and parametric) achieves this by enabling the system to ‘listen’ to only signals from the area of interest.
Location of Boulders
The geological makeup of the site was characterised by glacial material exposed at the surface, which then dipped to 20 to 30 metres sub-seabed in other areas. This pointed to the presence of boulders that had been left behind when the glaciers melted. Erosion over geological time resulted in an accumulation of boulders within a particular geological unit. There was a layer of marine clay above this unit, followed by a deposit of peat, then more clay, with a ‘boulder carpet’ located at the interface between the marine clay and the underlying glacial deposits. At greater depth, there were additional boulders, much fewer in numbers.
The Corer can detect and image boulders in this complex seabed, even when they are located within a surrounding gravel layer. The signal associated with boulders is particularly strong when they are in clay and sand. To size anomalies, the acoustic intensity is plotted against distance. The Corer can detect a ½-metre anomaly at a depth of 20 metres.
The acoustic data provided verification of the cone penetrometer results while also explaining the variability in the CPT measurements. [See Figure 4] In the 25 site locations the team surveyed, they identified 48 anomalies (individual boulders, clusters of boulders, gassy soils, and dense cobble layers). The Corer was able to image the geological layers beneath localised gassy soil areas, thereby reducing the uncertainty about the site. (See Figure 5) The team provided a statistical analysis of the aggregate data, linking the presence of boulders to a particular geological unit. A key finding was that the extrapolation of data from a given location was not valid beyond very local regions.
On a challenging wind farm development, planning may allow for up to 30 per cent refusals of piles (due to encountering boulders). This would necessitate having a drill rig on standby, at USD100,000 per day. With application of the Corer data, pile location adjustments can be made, reducing this risk to perhaps one refusal for the entire site.
Acknowledgements
Special thanks to Andrew Safer from Newfoundland for compiling the complete article.

Value staying current with hydrography?
Stay on the map with our expertly curated newsletters.
We provide educational insights, industry updates, and inspiring stories from the world of hydrography to help you learn, grow, and navigate your field with confidence. Don't miss out - subscribe today and ensure you're always informed, educated, and inspired by the latest in hydrographic technology and research.
Choose your newsletter(s)


