How Google Explores the 10th Planet
About Mermaids and Sea Serpents
NASA has spent tens of billions of dollars exploring Planet Earth and the other eight planets of our solar system, yet there is one last great frontier that has gone almost completely unexplored – Planet Ocean. The disparity between our understanding of Planet Earth and Planet Ocean is highlighted by the computer program and image repository Google Earth. However, the ability to use Google Earth below sea level provides a new platform for scientists to exchange oceanographic information and also deliver research findings to the general public.
Remote sensing satellites provide high-resolution imagery of all of Earth. Check out the skateboard ramp in our driveway in San Diego (32.839526, -117.100710).
The mapping of Mars is equally impressive with metre-level vertical resolution topography maps from a 6-year orbiting laser altimetry mission and sub-metre-level directed imagery of possible landing sites for robot explorers. Planet Venus was imaged in the early 1990s at 100m horizontal resolution from the NASA Magellan spacecraft using synthetic aperture radar (SAR) to penetrate its optically opaque atmosphere.
Deep Ocean
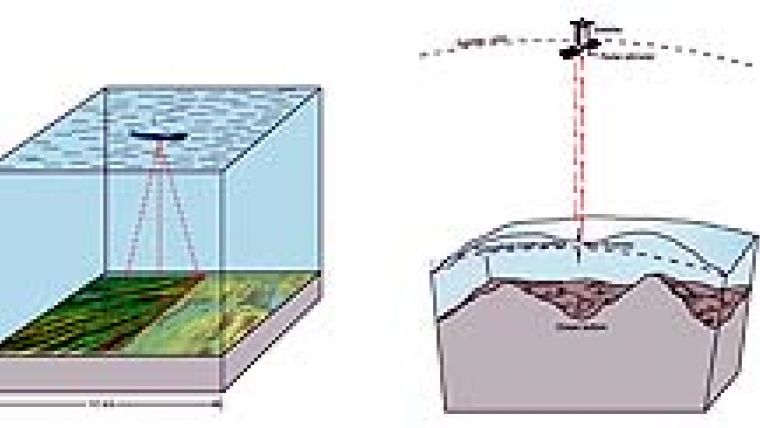
In contrast, more than two-thirds of our planet is largely unknown because it is masked by a 4,000m-deep ocean that is opaque to electromagnetic waves. Traditionally, echosounders aboard large vessels are used to map a profile or swath of sea floor topography
(Figure 1, left). More recently, very low-resolution estimates of sea floor topography have been obtained by satellite altimetry measurements of ocean surface topography (Figure 1, right). In the deep ocean basins, satellite altimetry can predict bathymetry at a scale of 6-9km. The resolution of echosounders is far superior to that of the satellite altimetry technique, but complete mapping of the deep oceans using ships would take 120 ship-years at a cost of billions of dollars. Indeed, the shipboard and altimeter methods are highly complementary. When interesting features are discovered in satellite gravity, these can be surveyed in fine detail by ships.
False Impression
Perhaps the most important message that will be provided by this new tool from Google is revealing how little we know about the deep ocean floor away from the continental margins. Ships have sailed across all the oceans, so one would imagine that Planet Ocean is well mapped and understood. This assumption could not be further from the truth. Acoustic echosounders, perfected during the Second World War, dramatically increased the number of global depth soundings, enabling scientists to draw preliminary sketches of the deep ocean basins. The bathymetry charts constructed by Bruce Heezen and Marie Tharp in the 1960s and 1970s revealed the mid-oceanic ridge and mapped the large-scale features of the entire ocean floor. Artistic sketches of the pervasive abyssal fabric of the oceans replaced the voids on these maps, previously filled by mermaids and serpents. The exquisite Heezen and Tharp maps, published by the National Geographic Society, gave the false impression that Planet Ocean was well mapped.
Despite GPS-navigated ships with modern swath mapping tools, there remain hundreds of giant voids in our mapping of the ocean basins the size of the state of New Jersey (Figure 2). The typical spacing of ship tracks in the southern ocean is 25,000m; this is 5,000 times worse resolution than some of the land imagery provided in Google Earth.
Missing Data
The beauty of Google Earth is that it provides a platform to reveal this huge disparity in resolution as illustrated in Figure 2. A 125km-wide signature was imbedded in one of the voids as seen in the Google Earth imagery of the Indian Ocean (N0 E94.75). The image on the right shows a map at exactly the same scale containing four large cities (Washington DC, Baltimore, Philadelphia, and New York). The full resolution of this satellite imagery is obvious in the lower image showing the stairs at the Lincoln Memorial at a magnification 5,000x greater than the images on the left and right. People and their shadows are evident in the morning sunlight. One may call the 80-mile-wide signature "graffiti", but it serves to illustrate that we know almost nothing about this region of ocean floor and hundreds of other areas just like it - call it a digital sea serpent. Improving our mapping of this void to erase the graffiti will require new satellite or ship measurements.
Displaying the land and ocean data together in Google Earth highlights the disparity between land and ocean mapping. The truth becomes clear: modern satellite remote sensing coupled with powerful computers and the hundreds of computer scientists at Google Earth cannot improve our understanding of the deep ocean basins. The relevant data simply do not exist!
Overlays
To further highlight this disparity, we have produced a set of overlays to Google Earth bathymetry that show both the inadequate ship track coverage as well as the contours of predicted depth to show areas where additional surveys would provide additional new information (Figure 3). All oceanographic research involves transits from ports to areas of interest and back. For example, given the spatial distribution of seamounts, there will in all likelihood be seamount targets along or near a transit section. We have developed a tool, based on Google Earth, to provide the information needed for anyone to visit uncharted seamounts. In addition, a more sophisticated track-planning tool should be developed that would help cruise planners by automatically producing an alternative track that optimises coverage of sea floor and target seamounts not previously visited, at the minimum additional survey time.
Mapping Recipes
There are three approaches for reducing the disparity in resolution between Planet Earth and Planet Ocean. The first approach is to simply assemble all data collected by echosounders since about 1950 and construct global maps. For example, the US Navy has collected about 120 ship-years of depth sounding and other types of data as part of the Ocean Survey Program. Unfortunately, these data remain classified for military purposes. There is, however, hope that existing data will become available after President Obama released a Memorandum in January saying the government should not keep information confidential. With the change in administration in Washington, the time is ripe to reconsider the declassification of the 120 ship-years of US data. Great Britain, France and Australia have collected similar classified or restricted data sets. Other countries such as Japan have recently opened all their sounding data for free access by anyone. These new open contributions are apparent when flying over the oceans in Google Earth. Nevertheless the major issue of the oceans south of the equator remains, as they are largely uncharted by anyone.
Second Option
The second approach is to deploy a fleet of ships carrying multi-beam echosounders. Modern echosounders (Figure 1, left) provide about 200m resolution topography maps in the deep ocean and higher resolution (~30m) sonar backscatter images. It would take about 120 ship-years to map the deep oceans - equivalent to 12 ships in a decade at a cost of a few billion dollars. The shallow seas would take much more time and funding because echosounder swath width is proportional to ocean depth. Of course, if all currently proprietary and classified data were released, it could be completed in perhaps five years.
Third Approach
The third approach uses radar alti-meters. The ocean's surface has broad bumps and dips that reflect variations in the pull of gravity (Figure 1, right). In the deep ocean basins, where sediments are thin and seabed geology is simple, satellite altimeter data can predict bathymetry at a scale of 6-9km - still 1,000 times worse than for Planet Earth but five times better than for Planet Ocean today. Existing satellite altimeter data have proved the feasibility of the technique and revealed the overall, large-scale tectonic features of the ocean basins. Indeed, 80% of the depths provided in Google Earth are derived from predicted depth based on satellite altimetry. A properly designed mission using existing technology could bring significant new resolution, capturing a critical scale of features, and facilitating new science and applications.
Next Generation
In December 2009, the European Space Agency will fly the next generation of radar altimeter aboard the CryoSat-2 spacecraft. This innovative satellite altimeter uses signal processing strategies borrowed from SAR to improve height measurement precision twofold, and to reduce along-track footprint size by a factor of five or more, in marked contrast to a conventional radar altimeter. Unfortunately, the CryoSat-2 ground segment cannot capture the full SAR waveforms globally, so it will mostly be operated as a conventional altimeter over the oceans. Nevertheless, even operated in a conventional mode, it could provide a significant improvement in our knowledge of the sea floor if the mission lasts for more than two years. This new altimetry mission combined with targeted high-resolution ship surveys offers the best approach to improving our maps of the ocean basins.

Value staying current with hydrography?
Stay on the map with our expertly curated newsletters.
We provide educational insights, industry updates, and inspiring stories from the world of hydrography to help you learn, grow, and navigate your field with confidence. Don't miss out - subscribe today and ensure you're always informed, educated, and inspired by the latest in hydrographic technology and research.
Choose your newsletter(s)


