Mapping Diamondiferous Gravel
Using the Aquares Resistivity System on a Fluvial Diamond Concession
An Aquares resistivity survey was carried out in a river in sub-Saharan Africa to map the sub-bottom features of a diamond concession. Diamondiferous gravels were distinguished remotely from bedrock and other soft sediments by the Aquares Resistivity System (ARS), a sub-bottom acquisition and profiling tool. It was selected due to its cost-effective operation and ability to provide qualitative and quantitative results. The ARS utilises recently developed processing innovations, which enable data to be presented in vertical sections and horizontal slices. This facilitates accurate volume calculations and the development of isopach maps for distinguishable types of bedrock and sediments.
Acoustic sub-bottomprofiling systems such as reflection- and refraction-based systems have traditionally formed the backbone of the near-shore shallow sub-bottom profiling market. In most cases, reflection-based systems provide a quantitative representation (i.e. providing depths and thicknesses of unconsolidated sediments) of the sub-surface in ideal conditions. Refraction- and some advanced reflection-based systems can offer limited qualitative assessment (i.e. providing information on quality as well as depth and thicknesses of both consolidated and unconsolidated sediments) of sub-bottom layers in addition to quantitative assessments, but again require ideal conditions.
Resistivity System
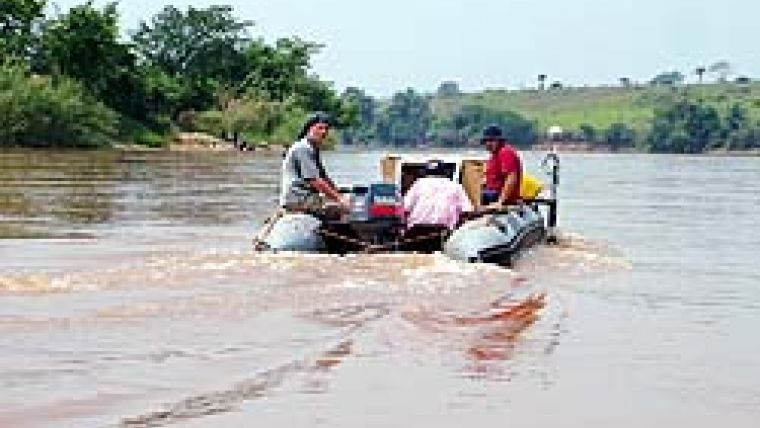
The Aquares Resistivity System (ARS) provides a high-resolution quantitative and qualitative assessment of sub-bottom structures in a range of conditions that would be beyond the capabilities of acoustic systems. Here, we investigate the performance of acoustic sub-bottom profilers and the ARS in shallow-water environments (~0.5 to 20m), and detail the performance of the ARS during a recent fluvial survey in sub-Saharan Africa (Figure 1).
Survey Setting
Demco NV (Demco) was asked to survey a fluvial diamond concession. The aim was to describe the local geological setting of the river with a specific interest in quantifying diamondiferous gravel deposits. These data would then be used to estimate the viability of the concession. The area of interest was a 30km stretch of river with a water depth that varied between 0.7 and 16m (averaging 4m) and is and is 150 to 400 wide. Frequent boulder-sized rocks, extensive gravel beds and rapids provide for a complex survey environment. The survey was conducted in October 2008.
Reflection-based Method
Reflection-based acoustic systems are currently the mainstay of shallow-water seismics and include pinger, chirp and parametric types, all operating at a frequency of approximately 10kHz. The process is well understood and (regardless of the type) is described simply as the firing of an acoustic signal into the seabed and measuring the time taken for that signal to return from the reflecting sub-bottom structure (i.e. two-way time). The performance and therefore the results of a reflection survey are limited by environmental conditions within the survey area, as well as a number of assumptions that are necessarily made during the processing of the returns. Limitations are due to multiple reflections, the presence of strong reflectors (calcarenite/caprock), shallow gas (gas masking), gravel (diffractions) and changes in the speed of sound (SoS) through different lithologies. The effect of multiple reflections from the sediment bed in a shallow-water reflection survey effectively limits the use of sub-bottom data to the equivalent of the water depth. The presence of strong reflectors, such as calcarenite or bedrock, will also greatly affect the quality of the returns below these structures if the signal can penetrate the strong reflector. The SoS through sub-bottom lithologies is the critical element for quantitatively determining the depth below the sediment bed and varies between layers. It is very difficult and impractical to determine the actual SoS of lithologies, especially in complex situations. In general, an experienced processor can give an educated guess of the SoS and provide a reasonable quantitative solution. However, inaccuracies in depth assessments become problematic when volume calculations are required over large areas.
Refraction Seismics
Refraction seismics is based on the principle that an acoustic wave will travel at different velocities through different lithologies. The method determines the depth and acoustic velocity of high-velocity lithologies underlying low-velocity sediments by registering the arrival time of refracted waves. The system, however, becomes unreliable when low-velocity sediments underlie high-velocity sediments and in the presence of mud. Refraction seismic results also tend to be less efficient in providing accurate depths and thicknesses.
Geophysical Method
The ARS is a modified resistivity-based system that combines unique aquisition and processing methods to provide high-resolution data from the sub-surface that is both qualitative and quantitative. The ARS is primarily used for sand searches, pre-lay cable surveys and pre-dredgesurveys to assist in dredge and port design. This is due to the ability of the ARS to distinguish between different sediment and rock types. During previous pre-dredge surveys for a port, an ARS survey augmented by limited boreholes helped engineers to visualise weathered and unweathered bedrock, as well as paleo-channels. This allowed for a design that took these features into account, resulting in considerably reduced dredging and construction costs.
ARS Development
The ARS has proprietary modelling tools that enable the system to enhance qualitative and derive quantitative results from the field curves. Field curves must be cleaned (and, if used in a marine or fluvial setting, compensated for depth and ambient sea-water salinity). Site-specific models are then developed to allow the resistivity results to be interpolated onto a regular grid. Results are then visualised in colour, as horizontal slices and vertical cross-sections, showing contrasting sediment and rock types as a function of geographic position and depth (Figure 2). All resistivity systems require geological structures to exhibit sufficient differences in resistivity from their neighbour in order to be differentiated. The resistivity of any geological structure is largely governed by porosity; for example, in marine environments, rock, gravel, sand and clay usually show incrementally higher porosities and thus lower resistivity, allowing them to be distinguished from one another. Other factors can affect resistivity such as varying salinities or clay content.
As with all geophysical methods, the ARS benefits from additional information provided by other geophysical and geotechnical surveys. This is particularly true for the characterisation of sediment and rock densities for engineering studies. Reasonable qualitative and quantitative accuracy can be attained, however, in the absence of additional data (as in this survey). Surveys in conjunction with geotechnical studies have demonstrated vertical accuracies of 0.1 to 0.2m. Information is also gained from either side of the survey line (approximately 5m to a maximum of 10m), with the width dependent on the penetration depth. If survey lines are run with sufficient density, the vertical sections can be stitched together to form a 3D model, allowing vertical sections or horizontal slices to be made along any axis desired.
Underwater ARS
The underwater set-up is based on the same principles as a land-based set-up, but is modified to work in a tow cable (Figure 3) that is ideally towed along the seabed. A typical marine set-up comprises a generator; acquisition and control laptop; power regulator; switch box; signal controller; navigation control; depth acquisition; conductivity, temperature and depth sensors (placed along the tow cable); an umbilical and a tow cable. Approximately 18A is injected into the subsurface every 2.5 seconds. The current required depends on the resistivity of the water, so for this fluvial survey in freshwater, 0.38mA was required. The ARS can work in depths of up to 200m and normally provides information on the first 15m below the sediment surface. The ARS is ideal for deployment on large or small vessels.
Survey Results
Approximately 30km of river with a width of 150–400m was surveyed in 10 days. Line spacings were 15m apart, resulting in a total of 450km of survey. Survey results (Figures 2 and 5, left graph at the right hand side) provided a representation of the diamond concession. As the survey was conducted in freshwater, bedrock (mudstone and sandstone) is characterised by low resistivities (represented by grey, purple and dark blue, ~20–60 Ohm metre (Ohmm)). Grey areas are likely to contain more mudstone intercalations, while the purple and dark blue areas may point to a higher proportion of sandstone. The remainder (80–250 Ohmm gradations) represent different types of unconsolidated diamondiferous gravel. The high line density (15m line spacings) allowed a 3D model of the river to be constructed. This model is visualised with vertical sections as well as horizontal resistivity slices. As a result, a gravel thickness map was made (Figure 5, right) representing the thickness of the diamondiferous gravels.
Obtained Results
The ARS provided a full 12m of penetration in water depths that varied from 0.7 to 16m. Obtained results were qualitative and quantitative, providing depths, thicknesses and distinguishing between varying grades of loose sediment and bedrock. The CR signature of diamondiferous gravel was determined on-site and used to derive quantities and value of diamond ore within the concession. Acoustic methods would not have provided such data due to the shallow and varying water depths, the presence of extensive gravel layers and the presence of boulders.
Resistivity Principles
In traditional land-based resistivity surveys, an electrical current is injected into the sub-surface by means of two current electrodes or a current electrode pair (CEP). The voltage gradient associated with the electric field of the injected current is measured by a voltage electrode pair (VEP) placed between the CEP (Figure 4). Based then on the values of current and voltage measured by the VEP, the average or calculated resistivity (CR) for the volume of sub-surface between the VEP is determined to a certain depth or penetration. Penetration is largely determined by the distance between the CEP and is a trade-off with resolution, i.e. a larger distance between the CEP results in lower resolution. Therefore, multiple CEPs are placed at increasing distances from the VEP to cover a range of depths while maintaining the maximum resolution at shallower depths. The measured result is a field curve (Figure 4) that reflects the changing CR from each CEP. In this example, the CR for CEP 1 (point 1) has returned a relatively low CR that rises quickly (points 2 to 3, etc.). This is typical of a thin layer of soft sediments overlying rock. The above-described field curves are then the basis for the qualitative assessment of the sub-bottom surface geology by all resistivity systems.

Value staying current with hydrography?
Stay on the map with our expertly curated newsletters.
We provide educational insights, industry updates, and inspiring stories from the world of hydrography to help you learn, grow, and navigate your field with confidence. Don't miss out - subscribe today and ensure you're always informed, educated, and inspired by the latest in hydrographic technology and research.
Choose your newsletter(s)


