Marine Asset Integrity Mapping
Using Multibeam Bathymetry, Topographic Laser Scanning & UAS Photogrammetry
Advances in marine & terrestrial scanning survey techniques together with precise inertial navigation sensors, multi-sensor acquisition systems and cost-effective UAS photogrammetry allow hydrographic surveyors to undertake high-precision marine asset integrity mapping. The benefit of this approach is that it produces a very accurate three dimensional digital elevation model that could be used as a baseline comparative survey to determine the long-term stability of sea walls and breakwater structures for engineering purposes.
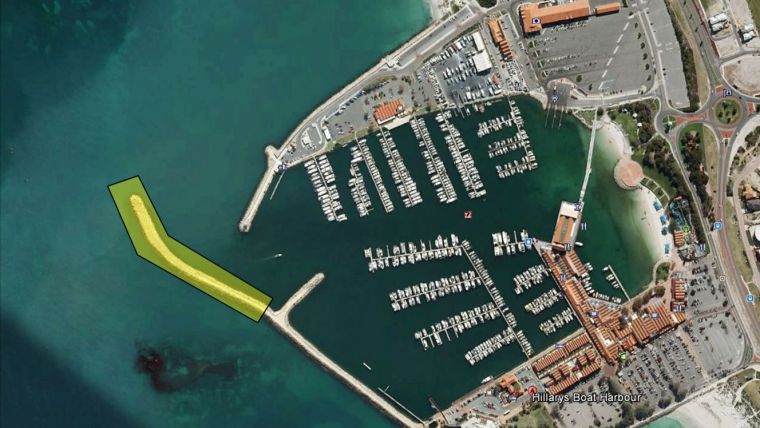
Marine GeoSolutions have extensive experience in acquiring combined multibeam bathymetry & topographic laser scanning datasets and partnered with Land Surveys to demonstrate the viability of this technology over a test area along the Hillarys Boat Harbour breakwater in Perth, Western Australia.
Survey Methods
A Reson SeaBat 7101ER-SV multibeam echo sounder, Riegl VZ-1000 topographic laser scanner, POS MV 320 inertial navigation system and ASCTEC Falcon 8 UAV were used to acquire the datasets. A RTK GNSS base station was installed on a local survey monument within 500 metres of the survey area. The survey instrumentation was installed on the inshore survey vessel and the lever arm offsets accurately measured. Separate patch tests were conducted to determine misalignments between the multibeam sonar and inertial RTK-aided inertial navigation system and between the topographic laser scanner and the RTK-aided inertial navigation system. The Hillarys light tower was used to conduct a patch test on the topographic laser scanning data (Figure 2). The laser patch test line plan involved imaging the light tower from three different sides with the lines being equidistant from the structure. For the patch test, the flat paving area around the light tower was used for the Roll Test and the vertical light tower itself was used for the Pitch & Yaw Tests. Any pitch offset in the data shows the vertical alignment of the light tower in all three patch test lines radiating from the ground like a bunch of flowers whereas any yaw offset shows the position of the light tower as a series of parallel vertical structures that are separated horizontally from each other. The multibeam sonar beam-forming was modified in the processor to ensure that the 511 equiangular-beams (EA) generated and were able to extend to the water surface when the sonar transducer was rotated by up to 40°. Two sets of survey lines were run 5m off the breakwater to simultaneously acquire multibeam bathymetry and topographic laser scanning datasets. The multibeam echo sounder was set to a ping rate of 18Hz at a 20m range scale generating 511 beams per ping whilst the topographic laser scanner acquired 5,000 samples per pulse. To ensure excellent data quality, particular attention was paid to data time-stamping, offset measurements and patch test bias determinations. All inertial positioning, laser scanner & multibeam echo sounder data acquisition, processing, system calibrations, dataset merging & most of the data visualisation were undertaken using HYPACK hydrographic software. Additional visualisation was performed in QPS Fledermaus. Only a minimum amount of data editing in both the multibeam bathymetry and topographic laser scanner datasets were necessary as the datasets were generally noise-free. The editing involved removing some spurious bathymetry and laser point data at the water/air interface.
A series of fifteen ground control points for the UAS photogrammetry were established on the breakwater using RTK GNSS positioning to enable the precise rectification of the photogrammetry imagery. A total of two 12-minute UAS flights over the breakwater produced forty-three photographs covering 100% of the breakwater.
Results
The primary aims of this survey were to test the repeatability and accuracy of the acquired data on separate survey runs and to investigate the size of the data gap that exists between the topographic laser scanner data (above the water line) and multibeam bathymetry data below the water line on a single survey run. Initially, the survey was run in a standard configuration with the multibeam transducer centre-beam projecting vertically down and the laser oriented to acquire data off the starboard side of the survey vessel.
In order to minimise the data gap between the laser scanner data and the bathymetry data, the multibeam transducer was rotated by 40° to physically steer the ‘sweet spot’ of the curved transducer array midway between horizontal and vertical to achieve increased data coverage across the flanks of the submerged breakwater (Figures 3 & 4).
In order to test the accuracy & repeatability of the topographic laser scanning and the positioning system, two small objects were placed along the skyline of the Hillarys breakwater to investigate if these items could be mapped with the laser system. One of the items (a Crown beer bottle) was left stationary on the breakwater for two separate survey runs, and a second item (a Blackberry phone) was moved a small distance (0.070m) between the two survey runs. Comparisons of the skyline laser data between the two survey runs revealed an agreement of ± 0.01m for the centre-point of the stationary Crown beer bottle position, while the two recorded positions of the Blackberry phone confirmed that the phone had been moved one phone width (0.075m) between the two survey runs; the actual phone width is 0.070m. The results of this test are shown in Figure 5.
A second test was performed to simulate a rock displacement on the breakwater, which could affect the structural integrity of the structure. A 0.5m3 box was used to model the rock displacement and was repositioned on a subsequent survey run. The results indicate that the displacement of a small rock could be easily detected using this technology.
To quantify the expected levels of accuracy achievable using the combined multibeam bathymetry and topographic laser scanning, the positions and elevation of the ground control points (GCP) where compared to the laser point cloud data. In general, the XYZ positions were within a centimetric accuracy. (Table 1).
|
GCP Station ID |
RTK Survey Control Elevation (m) |
Laser Elevation (m) |
Position Difference |
Elevation Difference (m) |
|
|
dE (m) |
dN (m) |
||||
|
9001 |
4.479 |
4.470 |
0.025 |
0.022 |
0.009 |
|
9004 |
3.931 |
3.940 |
0.021 |
0.303 |
-0.009 |
|
9005 |
1.736 |
1.730 |
0.036 |
0.023 |
0.006 |
|
9006 |
2.806 |
2.820 |
0.090 |
0.134 |
-0.014 |
|
9007 |
1.209 |
1.210 |
0.020 |
0.111 |
-0.001 |
|
9010 |
0.689 |
0.700 |
0.051 |
0.018 |
-0.011 |
|
9014 |
0.724 |
0.740 |
0.012 |
0.100 |
-0.016 |
|
9015 |
1.013 |
1.020 |
0.000 |
0.070 |
-0.007 |
|
Mean Elevation Difference |
0.009 |
||||
Table 1: Tabulated differences between the GCPs and the topographic scanning laser point cloud data.
The photogrammetric reprojection error for the UAV aerial imagery was less than 0.008m when processed using the ground control points.
Conclusions
This paper demonstrates that the combined use of a topographic laser scanner, multibeam echo sounder and UAV photogrammetry together with precise inertial navigation and robust calibrations yield centrimetric accuracy for high-precision marine asset integrity mapping. As these datasets are acquired from various different incident angles, this produces a seamless digital elevation model (DEM) with very few, if any, areas which have not been insonified or imaged. The precision and repeatability of this technique is high, with multiple runs of the same survey line showing overall errors of less than 0.010m between all sensors. The modular design of the system means that surveys can be conducted simultaneously and on the same day for small areas, without the need for waiting on tidal level variations.
The benefit of this approach produces a very accurate three dimensional digital elevation model which could be used as a baseline comparative survey to determine the long-term stability of sea walls and breakwater structures for engineering purposes. It is postulated that marine structure subsidence can be monitored to better than 0.020m.
Any structural instability in a seawall or breakwater will cause the construction ‘rock’ blocks, rubble or concrete armour units to move, slide or be buried in the underlying marine sediments. By undertaking a surface difference comparison of the XYZ gridded datasets between the high-precision baseline survey and a subsequent follow-up survey, the surveyor or engineer can ascertain which areas of the marine structure have remained stable and which show any displacement. Once the areas showing displacement have been identified, one can investigate the XYZ point cloud data carefully in these selected areas to determine the exact nature and severity of the displacement and how this will affect the structural integrity of the installation. These data can also be utilised to plan any remedial engineering intervention.

Value staying current with hydrography?
Stay on the map with our expertly curated newsletters.
We provide educational insights, industry updates, and inspiring stories from the world of hydrography to help you learn, grow, and navigate your field with confidence. Don't miss out - subscribe today and ensure you're always informed, educated, and inspired by the latest in hydrographic technology and research.
Choose your newsletter(s)


