Oceans of Colour
Connecting Past and Present
Natural water colour measurements are based on multi- and hyper-spectral measurements performed in the field and from space. A simpler approach to determine the colour of natural waters is by means of the Forel-Ule colour comparator scale. This scale has been applied globally and extensively by oceanographers and limnologists since the 19th century. Colour classification according to the Forel-Ule method, through participatory science, i.e. with the help of the public, as developed within the EU project Citizens’ Observatory for Coast and Ocean Optical Monitoring (Citclops), will facilitate this need by connecting the present and the past.
What Gives Colour to Seas, Lakes and Rivers?
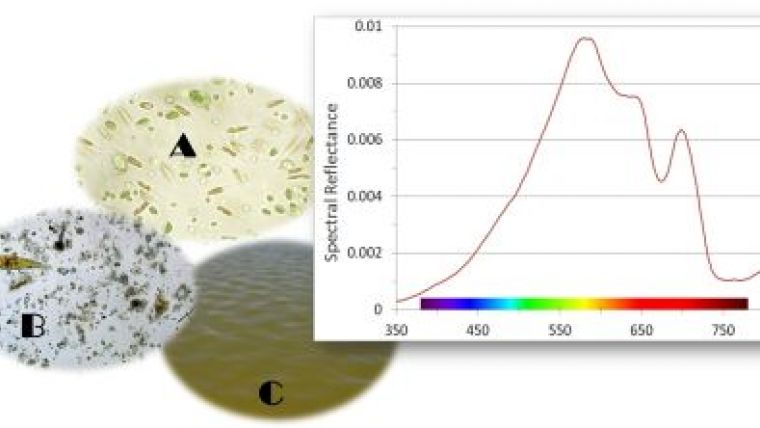
The colour of the water, together with its clarity, is one of the most apparent characteristics to the human eye when natural water is observed. The colour of distilled water, water which contains nothing but water itself, is blue. This is caused by the water molecules that absorb all sunlight between red and green. Blue sunlight is scattered back. That is why the open ocean water appears to be indigo blue to us. Also think of swimming pool water. In general, the apparent colour of natural water is a result of substances that are either suspended or dissolved in the water column, in addition to molecular absorption and scattering,. There are three main components besides the water itself affecting the colour of natural waters (see Figure 1):
- Phytoplankton (microscopic algae) or chlorophyll containing particles. These organisms generally cause a green colouration of the water (due to the presence of chlorophyll within their cells), except for certain species of phytoplankton that cause a red or brown colouration.
- Non-algal matter, such as fine soils (chalk). Its effect on the water colour will depend on the origin of the material (brownish or reddish) but in general it gives a ‘cloudy’ effect to the water.
-
Dissolved coloured matter, mainly organic compounds including humic acids and tannins that originate from many types of terrestrial and aquatic plants, and give the water a yellow to brownish colouration.
The Forel-Ule Scale
The first part of the sea colour comparator scale was described by François Alphonse Forel in 1890. In 1892, Willi Ule extended the scale with eight more tints. The combined scales (Forel’s colours 1 (indigo-blue) to 11 (green-blue) and Ule’s part 12 to 21 (cola-brown)) became known as the Forel-Ule scale (Figure 2). A colour measurement with a Forel-Ule scale should be done in combination with a white disk of 30 cm diameter. This disk, the so-called Secchi disk, is normally used to determine the transparency of a water body by lowering the disk into the water until it disappears from sight. The disappearance depth in metres is noted as Secchi disk depth. A Forel-Ule observation is done over the Secchi disk at ½ its depth. The observer compares the colour of the water column over the disk with one of the scale colours.
One of the first maps with Forel-Ule sea colour observations appeared in scientific literature in 1902 (Figure 3). Data were collected during the German Deep sea expedition on MS Valdivia between 1898-1899. Inlay: Carl Chun (1 October 1852 – 11 April 1914) was a German marine biologist.
The Public and Science
Within the framework of participatory science the public can help science by using a Forel-Ule smartphone App (Figure 4) developed under the EU-project Citizens Observatory for Coast and Ocean Optical Monitoring (see www.citclops.eu). A selected area of the sea can be chosen on-screen and saved. The colour of the water can be compared with the on-screen Forel-Ule colour bar. Pictures and metadata are sent to the Citclops database for further analysis via Wi-Fi. In this way, historical data can be complemented with new data collected by the public.
Why is it Important to Know the Colour of Natural Water?
In addition to water temperature, salinity and transparency (see Water transparency), water colour observations belong to the oldest time series of climate data. Water colour is an Essential Climate Variable (ECV) designated by the World Meteorological Organization (WMO) for which sustained and climate quality measurements are needed to track and analyse climate change. This is currently considered an important aspect of the science of natural water optics, as the colour of the ocean is partly determined by phytoplankton. A variation in phytoplankton abundance implies a change in the uptake of CO2, the most common greenhouse gas, suggesting a possible role for these organisms in the regulation of the climate.
Coastal waters, rivers and lakes can vary in colour due to natural events, such as algal growth, making the water greener during spring. However, the colour can also be affected by human activities, for example, the addition of nutrients, such as phosphates and nitrates (through sewage or fertilisers), that cause phytoplankton to grow. This phenomenon is known as eutrophication. A change in water colour not only affects the aesthetics and the recreational value of a water body (generally people prefer to swim in blue-green clear waters than in dark and murky waters), but could also have a harmful effect on the environment, such as that caused by harmful algal blooms.
Sampling the Colour of the Sea
Damen Shipyards Gorinchem, the Netherlands, is the headquarters of the Damen Shipyards Group. From here new build vessels are delivered all over the world. One of Damen’s captains, Jaap de Jong, was willing to perform ocean-colour measurements during his ship delivery trips. Crossing the world’s seas he provided the researchers with valuable Forel-Ule and Secchi disk data. Table 1 shows the dates and positions, between Shanghai and Djibouti, of Forel-Ule observations performed by Jaap de Jong during one of his vessel deliveries. At 12 noon this captain stoped his ship and performed observations for the Netherlands Institute for Sea Research. Six differently coloured natural waters are shown in Figure 5; top left to right; Yangtze river, East China Sea, South China Sea more northern, bottom left to right; South China more southern, Arabic Sea and close to Djibouti.
|
2014 at 12:00 noon |
Position N |
Position E |
Location |
|
March 1 |
Yangtze River |
Leaving Shanghai |
|
|
March 2 |
28.26 |
122.38 |
East Chinese Sea |
|
March 5 |
20.14 |
116.07 |
South Chinese Sea |
|
March 7 |
14.28 |
112.31 |
South Chinese Sea |
|
March 31 |
19.12 |
58.08 |
Arabic Sea |
|
April 6 |
11.35 |
43.07 |
Djibouti |
Table 1: Dates and positions of Forel-Ule observations performed by a Damen captain.
Figure 6 Example of a long-track sea colour observations at the South Chines Sea and the Pacific. The images and real Forel-Ule observation can be uploaded to the Citclops website.
More Information
- Chun, Carl, 1902. Wissenschaftliche Ergebnisse Der Deutschen Tiefsee – Expedition auf dem Dampfer „Valdivia" 1898-1899, im Auftrage des Reichsamtes des Innern, herausgegeben von Carl Chun, Professor der Zoologie in Leipzig, Leiter der Expedition, erster band, Jena, Verlag von Gustav Fischer.
- Cialdi, M and Secchi, P.A., 1865. Sur la transparence de la mer. Comptes rendus hebdomadaire de séances de l’Academie des Sciences. Paris: Academie des Sciences. Volume 61. pp 100-104.
- Forel, François Alphonse, 1998. Le Léman. Monographie Limnologique. Tome II. Slatkins Reprint, Genève. A reprint of the Lausanne 1895 edition. ISBN 2-05-101610-0. pp 453-547.
- Ule, Willi, 1892. Die Bestimmung der Wasserfarbe in den Seen. Kleinere Mitteilungen. Dr. A. Petermanns Mittheilungen aus Justus Perthes geographischer Anstalt. Gotha, Justus Perthes. pp 70-71.
- Wernand, M.R., and W. Gieskes, 2011, Ocean Optics from 1600 (Hudson) to 1930 (Raman), shifting interpretation of natural water colouring. Union des Océanographes de France, Paris, ISBN: 978-2-9510625-3-5 (book).
Dr Marcel R. Wernand is a senior research scientist at the Royal Netherlands Institute for Sea Research and has more than 35 years of experience in marine optics and remote sensing. He obtained a polytechnic degree in mathematics and physical engineering from the school for higher professional education (COVALU, Utrecht, the Netherlands) and started as an optical instrumentation developer at NIOZ in 1977. He obtained a PhD degree in Science (Physics and Astronomy) from the University of Utrecht (the Netherlands) in 2011.

Value staying current with hydrography?
Stay on the map with our expertly curated newsletters.
We provide educational insights, industry updates, and inspiring stories from the world of hydrography to help you learn, grow, and navigate your field with confidence. Don't miss out - subscribe today and ensure you're always informed, educated, and inspired by the latest in hydrographic technology and research.
Choose your newsletter(s)


