Overcoming challenges in Alaska’s landslide risk assessment
Acquiring and processing bathymetric data before tsunami-generating landslides occur
Alaska’s history of devastating landslides and tsunamis creates challenges in assessing communities’ risk without water depth data at the base of unstable slopes. To address this, the US Geological Survey and NOAA Office of Coast Survey contracted Woolpert in May 2020. Within four months, Woolpert had developed a web GIS tool that acted as a real-time vessel tracker, allowing NOAA to monitor vessel movement and water depth data collection. The project’s success can be attributed to consistent communication and real-time visibility.
When most people envision Alaska, picturesque mountains, dense forests and snow frequently come to mind. Landslides, tsunamis and devastation rarely do, even though the state has a long history of them. However, according to the National Park Service: “In the last century, ten of the 14 highest tsunamis in the world were in glaciated mountains and four were in Alaska parks, which include vast tracts of glaciated terrain” (nps.gov Vol. 18, Issue 1). Two of the most well-known tsunami-generating landslides in the state are those at Lituya Bay in 1958 and Taan Fjord in 2015. Considering the state’s history and trends, it wasn’t surprising when a retreating slope in Barry Arm worried local geologists.
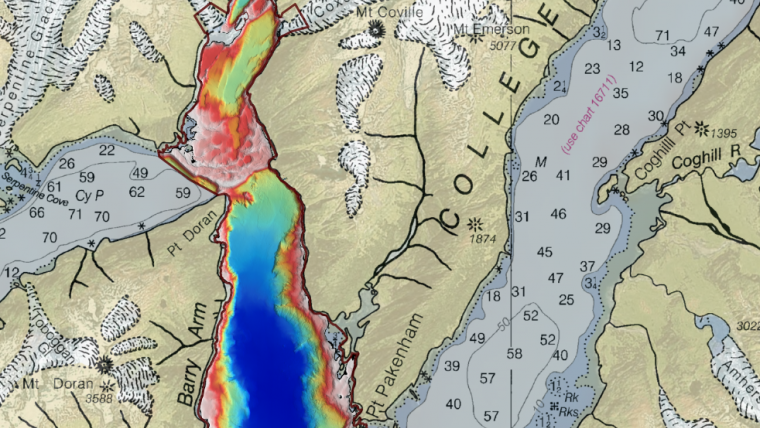
Barry Arm is a glacial fjord 60 miles east of Anchorage, Alaska. The steep, unstable slope has the potential to produce tsunami-generating landslides that could result in catastrophic loss of property and life in the area. However, understanding the risk to neighbouring communities such as Chenega, Whittier, Tatitlek, Valdez and Cordova required data confirming water depths at the base of the slope. This critical information was unavailable because of Barry Glacier’s recent retreat, which exposed more of the seafloor. Still, the US Geological Survey (USGS) and the Alaska Division of Geological & Geophysical Surveys (DGGS) needed the data to understand the underwater structure of the glacier’s slope, while the National Oceanic and Atmospheric Administration’s (NOAA) National Tsunami Warning Center required it to determine where water displaced by a landslide would go and how it would affect local populations.
The need for foundational insights prompted the USGS and NOAA Office of Coast Survey to fund the acquisition and accelerated processing of bathymetric survey data in May 2020. For the project, the Office of Coast Survey contracted Woolpert to gather approximately 17 square nautical miles of high-resolution, complete coverage, multibeam data extending from the potential landslide base area to the terminal moraine of Barry Arm.

Surveyors had to complete data collection and processing within four months of the contract award. Some organizations require months of preparation to approach a project that focuses on seafloor depth, feature mapping and underwater slope structure imaging. However, because it was critical to acquire and process bathymetric data before any landslides occurred, the project team had to accelerate its emergency response capabilities, including fast mobilization, efficient workflows and expedient delivery of high-value data products.
Rear Adm. (ret.) Shepard Smith, then-director of the Office of Coast Survey, said of the completed survey: “This multi-agency collaboration will help scientists and officials prepare for this potential hazard and work to keep our mariners and communities safe. I am also very pleased that we were able to establish a hydrographic survey contract so quickly and work with eTrac (which was acquired by Woolpert in 2022) to collect this critical bathymetric data.”
The clock is ticking
Mobilizing vessels, equipment, sonar technology and staff happened within 24 hours of Woolpert’s project award. Still, the most critical components needed to achieve the aggressive state and federal schedule requirements were consistent communication and real-time visibility of vessel movement.
“We developed a web GIS tool that’s a real-time vessel tracker,” said Izzy Kratchman, hydrographic surveyor for Woolpert. “During the project, NOAA could see the vessel moving and know where it was, and that information was updated every six seconds, making it a great tool for communication.”
If, for example, a vessel was unable to access areas of the project scope because of water depths, NOAA and surveyors could access the GIS web tool from different locations, see the issue and discuss potential solutions. This process was especially helpful when considering the alternatives, as surveyors could take screenshots and send them via email, hoping for a timely response.

Additionally, if the surveying team wanted to draw NOAA’s attention to a specific area, they could use the GIS web tool to highlight the area of concern, download the corresponding image and send it to NOAA for their team to view in a web browser. From there, both parties could focus on the same area of Barry Arm. “This was a real-time utility we used to talk about things,” Kratchman said. “When we had a problem with something, we were all looking at it together in real time.”
With consistent communication playing just as essential a role as the emergency response capabilities and quick mobilization, gathering the bathymetric data to help risk mitigators prepare for the future effects of potential landslides became possible within the limited time frame. Processing that data quickly, however, required another unique component to ensure the project’s completion in the race against time.
No time to double back
For this emergency response project, it was imperative to do one thing when processing the data: supply the analytics to a datum. Understanding this step’s purpose is easier when considering the construction industry. In that example, the datum provides visibility of what is being built and to what specifications. This transparency ensures that construction workers are on the same page, regardless of their role in the project. Similarly, surveyors supplied data into a navigation datum called the Mean Lower Low Water (MLLW), which tracks tides and provides water depths at the lowest tide possible to help with navigation.
Afterwards, surveyors used a satellite communication correction service to pinpoint the vertical positional accuracies (within ten centimetres) of vessels anywhere on Earth. Surveyors therefore did not have to set up base stations or coordinate extensive logistics – they simply received corrections through a satellite.
“After getting to a ten-centimetre accuracy using the satellite system, we coupled it with what’s called a separation model,” Kratchman said. “That model took the general GPS position and transformed it to the MLLW datum in real time. When these two things were put together, we could colour in depths on our chart. As our vessel navigated through the water, the colours showed on our screen in real time, enabling us to create an accurate representation of our project boundary and the required depths.”
This process enabled surveyors to visit shoreline areas, collect data at necessary water depths and leave without returning. The method was an upgrade from traditional procedures that require surveyors to collect data, apply GPS corrections, evaluate progress and double back to the project site to fill in gaps. With the streamlined approach, surveyors saved time they couldn’t afford to lose.

Using data to navigate a slippery slope
With the bathymetric data in tow, federal and state partners are taking necessary steps to prepare for potential tsunami-generating landslides in Barry Arm. DGGS is adding the new insights to its high-resolution Lidar dataset for the steep underwater slope and surrounding hillsides. The data will also complement the USGS’s satellite-based radar to ensure scientists can track the slope’s movement.
“The bathymetric data is a critical foundational element of a multi-agency assessment of the coastal marine hazard and tsunami threat in Barry Arm and the nearby coastal communities,” said Aimee Devaris, USGS Alaska regional director. “Expedited access to the data will enable USGS and the Alaska Division of Geological and Geophysical Surveys to accurately map the Barry Arm landslide above and below the water in order to evaluate the hazard and aid in the development of a surveillance strategy.”
NOAA is also utilizing the bathymetric data to update its charts. When commenting on the value of the data, Dr James Gridley, director of the NOAA National Tsunami Warning Center, said: “Understanding the depth and shape of the Barry Arm fjord means the National Tsunami Warning Center will have a better grasp of the tsunami risk if and when a landslide occurs. We could not have improved our mission confidence for the Barry Arm threat without this critical dataset.”

Increasing safety in multiple ways
When a glacial slope is at risk of causing tsunami-generating landslides, the primary goal must focus on acquiring and processing bathymetric data to determine how neighbouring communities will be affected – but what’s the secondary goal? An excellent one is charting newly navigable water that’s only accessible because of the same retreating glaciers that threaten nearby populations. “Cruise and tourism ships were navigating these waters, and it was dangerous because those waterways were uncharted,” Kratchman said. “As a secondary goal, we went into this no man’s land to collect depth data. We were the first people ever to survey there.”
Federal and state partners are using the data to update their charts to provide vessels with the necessary information to increase passenger safety. As relevant parties make critical updates, the bathymetric data will continue to prove valuable for risk mitigators who want to prevent catastrophic loss from retreating glaciers as well as vessels wishing to navigate newly accessible waters made possible by those same receding glacial slopes.


Value staying current with hydrography?
Stay on the map with our expertly curated newsletters.
We provide educational insights, industry updates, and inspiring stories from the world of hydrography to help you learn, grow, and navigate your field with confidence. Don't miss out - subscribe today and ensure you're always informed, educated, and inspired by the latest in hydrographic technology and research.
Choose your newsletter(s)


