A New Solution for Subsea Metrology
Combination of Acoustics and Photogrammetry
Invariably, metrology is required at the critical stages of field development and the main goal for improvement is to reduce the time taken for acquiring data. The technique discussed offers significant improvements in terms of time and required equipment.
Offshore Construction
During offshore construction several structures have to be interconnected by means of spools or jumpers. In order to determine the dimensions and relative attitudes of the connections, surveyors deploy ROV-mounted instrumentation.
IMCA S019 Guidance on Subsea Metrology offers the following combined accuracy guideline:
50mm to 150mm in X,Y and Z axis
0.5° to 1° for relative pitch, roll and heading.
As in most surveying activities, it is good practice to get two or more different measurements to allow QC.
The final combined accuracy of acoustic metrology can be estimated by considering the contributing error sources:
|
MF acoustic baseline measurement |
±20.0mm |
|
Fabrication error in PLET metrology bucket (transponder mount) |
±5.0mm |
|
Fabrication error in PLEM metrology bucket (transponder mount) |
±5.0mm |
|
Fabrication error in PLET centralising collars |
±1.5mm |
|
Fabrication error in PLEM-Y centralising collars |
±1.5mm |
|
Error in PLET inclinometer beacon (0.1 degree over 1.200m) |
±3.5mm |
|
Error in PLEM-Y inclinometer beacon (0.1 degree over 1.200m) |
±3.5mm |
|
Total Error in Slant Range Measurement |
±40.0mm |
It is seen here that 30% of the error is due to the metrology interface (bucket and centralising collar). Over 20% is added by the necessity to perform the measurement on an offset point in order to allow installation of the measurement tool. Avoiding the use of metrology interface greatly improves the achieved accuracy.
Spool or jumper life duration is potentially affected by metrology accuracy as too is the time spent on installation – this is clearly the case where a unit cannot be installed and is recovered for modification.
Metrology Methods
Four main methods are in use:
- Acoustic LBL (Long Base Line)
- Inertial instruments used alone or in association with acoustics
- Photogrammetry
- Divers using taut wire
Acoustic and inertial methods allow for long range measurement, but also require installation aids and an onshore dimensional control survey. Attitude and Z values are obtained by measurement using additional tools such as pressure sensors and gyrocompass.
Calibration and the merging of onshore measurements during the dimensional control survey are a source of error, not always easily detected by QC. They also require a metrology interface, itself a source of error and best avoided to improve the final accuracy.
Taut wire method is limited in term of depth and distance and QC is very limited. This solution is also time consuming due to the necessity to operate with divers in saturation.
Photogrammetric methods do not require any physical contact with the points of interest and are capable of high accuracy but the range is very limited.
|
Comparison of existing methods |
inertial |
acoustic |
photo |
diver |
|
Dimensional control survey required onshore |
Y |
Y |
N |
Y |
|
Relative hubs attitude |
Y |
N |
Y |
Y |
|
Contactless metrology |
N |
N |
Y |
N |
|
Absolute positioning |
Y |
Y |
N |
N |
|
Metrology interface to be installed on structures |
Y |
Y |
N |
Y |
|
Additional tooling required for attitude and orientation |
N |
Y |
N |
Y |
|
Estimated duration for one metrology on a 25m spool |
10h00 |
18h00 |
15h00 |
variable due desaturation |
|
Quality check and/or redundancy |
Y |
Y |
Y |
limited |
|
Good visibility required |
N |
N |
Y |
Y |
Table 1: Existing methods comparison
As can be seen, only photogrammetry does not require contact with the reference measurement point. This is a significant advantage for manifolds and installed subsea assets in production where metrology interface installation and onshore dimensional control surveys are not possible.
Proposed New Method
On the BURULLUS Gas Field development project in Egypt, we had to perform one metrology between a production manifold and a new PLET (Pipeline End Termination), while avoiding a production shutdown during the measurement procedures.
Our basic proposal was to take two existing methods to develop a third improved option by merging the strong points of each. A combination was devised using LBL acoustics for their long range capability and photogrammetry for short-range high accuracy over each end of the new connector.
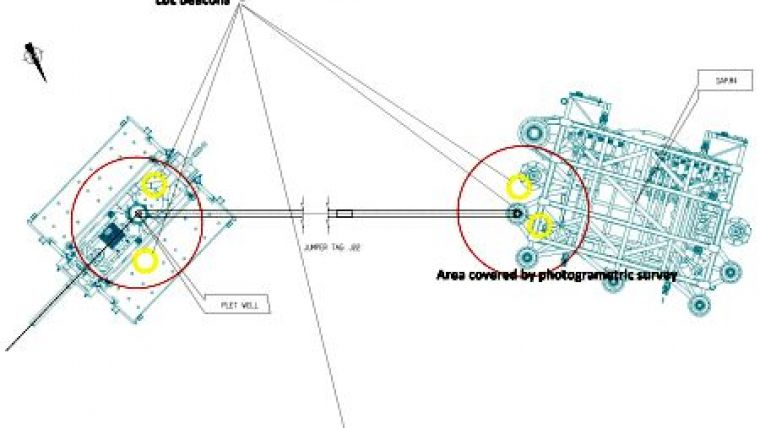
Photogrammetry offered tri-dimensional views of the areas of interest with an expected accuracy of a few millimetres. Then the two photogrammetric scenes were combined using acoustic methods with two LBL beacons from the seafloor array located within each photogrammetric scene. The acoustic array provided a common reference frame to link the two scenes.
On each side, there are then two points (the beacons), which after processing are known in terms of local 3D photogrammetric coordinates and the absolute LBL coordinate system (see Figure 2).
Applying rotation and translation matrices transformed the coordinates of all points of interest into a common 3D reference system.
The relative attitude (pitch, roll, heading) of the two hubs was obtained from beacons with inclinometer end caps.
The LBL array was deployed with six beacons (in this case SONARDYNE COMPATT 6)
- 2 beacons with SVP sensor
- 2 beacons with inclinometers
- 2 beacons with pressure sensor
Beacons with SV (sound velocity) sensors were used to correct measured distances, and inclinometer and pressure sensors provided information to determine a common vertical reference on each side.
Photogrammetric processing requires some known distance measurements in order to scale the results: targets were added directly onto the beacon or brackets and distance between targets accurately measured.
In the field the process required, firstly, a routine ROV and LBL array deployment and calibration. Secondly, the photogrammetric shooting of each survey area was undertaken – the basic rules were for pictures every 30° around the area of interest and an overlap of 50% between two consecutive pictures.
Expected Accuracy
Photogrammetric processing offers an expected internal accuracy generally around 0.2mm/m and in this case >5mm.
The LBL beacons utilised during the project were specified by the manufacturer as accurate <20mm, after sound velocity corrections. On this project, after network adjustments, the total overall error on the baseline was estimated <7mm.
Processing and QC
Photogrammetric processing is performed onshore using specific software and generates a CAD file for each hub in the local coordinate framework.
QC is performed using distances already measured such as between the beacons included in the photogrametric survey and/or known distances taken from as-built drawings of the structure.
Final measurements are obtained using the CAD drawing.
Results
This method was successfully implemented during a jumper installation on the project in the Mediterranean Sea in 750m water depth. The results were compared to results obtained using standard acoustic metrology.
The accuracy expected by the photogrammetric processing was around 5mm; the check performed on the distance between two beacons versus distance measured on the photogrammetric CAD file was 0.5mm in X and Y axis and 5.0mm on Z axis. The spool length comparison with the acoustic metrology was less than 70mm. This difference was accounted for by some non-managed offsets on the bracket used during acoustic metrology.
The duration of the combined metrology was approximately 6 hours (post processing not included). This method does not require a metrology specialist on board as LBL deployment and photo shooting are standard tasks for a survey team.
The most surprising aspect of this trial was how straightforward we found the computations.
Conclusions
This method could result in significant improvements in terms of accuracy, simplified operation and a cost reduction for subsea metrology. Additionally, the QC performed allows for precise quantification of errors and increases confidence when engineering the final piece.
Now working on a new approach to perform the processing on board vessel to reduce time lost during processing offshore and image transfer. This method could also be applied to other short range / high accuracy methods like laser or acoustic 3D scanner.
Acknowledgements
Thanks to David Hulbert for his review of this paper.
Eric Guilloux is a project surveyor who has been employed by SAIPEM France for the past 4 years. He has worked in the hydrographic survey and positioning industry over the past 25 years and he his hydrograph (FIG/OHI). Eric has gained experience in projects both on and offshore including machines guidance, subsea asset installations and reference GPS network deployment.

Value staying current with hydrography?
Stay on the map with our expertly curated newsletters.
We provide educational insights, industry updates, and inspiring stories from the world of hydrography to help you learn, grow, and navigate your field with confidence. Don't miss out - subscribe today and ensure you're always informed, educated, and inspired by the latest in hydrographic technology and research.
Choose your newsletter(s)


