Acquiring and Integrating Bathymetric Lidar
Developing a Seamless Coastal DEM from Topographic and Bathymetric LiDAR Data
We investigated the most significant issues affecting the creation of a littoral zone digital elevation model from overlapping bathymetric and topographic Lidar (light detection and ranging) data. The main challenge was found to be the use of different methodologies used to establish vertical datums, as well as the narrow overlap between the two data sets, lack of ground control points and data gaps. We identified the main causes of gaps in bathymetric Lidar data and outline a new procedure for quantifying their occurrence.
The Cooperative Research Centre for Spatial Information in Australia has been collaborating with the Victorian Department of Sustainability and Environment (DSE) on a pilot project. The project investigated issues and technical challenges faced in the acquisition and development of a continuous Lidar-based digital elevation model (DEM) that traverses the littoral zone. Results of the pilot project based on recently acquired terrestrial and bathymetric LiDAR data are presented here.
Main Objectives
The Victorian DSE recently commissioned the collection of airborne bathymetric LiDAR data over four case study sites along the Victorian coast. These sites were located at Portland, Port Phillip Bay, Western Port Bay and Lakes Entrance (Figure 1). Simultaneously, topographic Lidar data were collected to overlap the bathymetric Lidar data at the Port Phillip Bay site. The main objectives of the project were (1) to assess the performance of bathymetric Lidar under typical conditions along the Victorian coast, and (2) to identify technical challenges involved in integrating bathymetric and topographic Lidar data to create a smooth and seamless coastal DEM.
Lidar Data Gaps
For the purposes of this paper, a gap in bathymetric Lidar data is said to occur when no sounding was obtained, either due to the system receiving no laser return signal or an unreliable return signal. The case study results demonstrate that there are five main reasons why gaps may occur in bathymetric Lidar data. These include turbidity, sea floor type, depth, shallowness (in depths of less than 30cm it becomes very difficult for the data-processing system to differentiate between the water surface and the sea floor) and physical obstructions.
A successful bathymetric Lidar survey will have minimal (or at least acceptable) data gaps. An unsuccessful survey will contain more gaps than are acceptable, so rendering the data unsuitable for the purposes for which it has been collected. The existence of gaps is generally dependent on one or more environmental factors (Table 1, below). The second column of Table 1 provides recommendations for minimising the impact of these factors on the results of a bathymetric Lidar survey.
Assessing Coverage
A new method for assessing coverage of bathymetric Lidar surveys was developed. The tile-coverage method comprises two parts: coverage per tile and acceptable tiles per survey. The former part involves subdividing the survey area into tiles of an appropriate size, determining the number of successful soundings per tile and comparing this to the expected number of soundings. The side lengths of each tile should nominally be half the inter-flight line distance. If flight lines are 200m apart, tiles are therefore chosen to be 100m×100m (i.e. 1 hectare) in size. Complete (100%) coverage is achieved when the number of successful soundings in a tile is equal to (or greater than) the expected number. For example, if data spacing is 5m×5m and tile size is 100m×100m, there should be 400 soundings per tile. If a tile has 300 successful soundings, 75% coverage has been achieved in that tile.
The number (percentage) of tiles with acceptable coverage must then be computed, highlighting the existence of large data gaps, even though the total percentage of acceptable soundings may be high. The level of ‘acceptable' coverage is determined on a project-by-project basis, but 80% would suffice for most applications.
Case Study
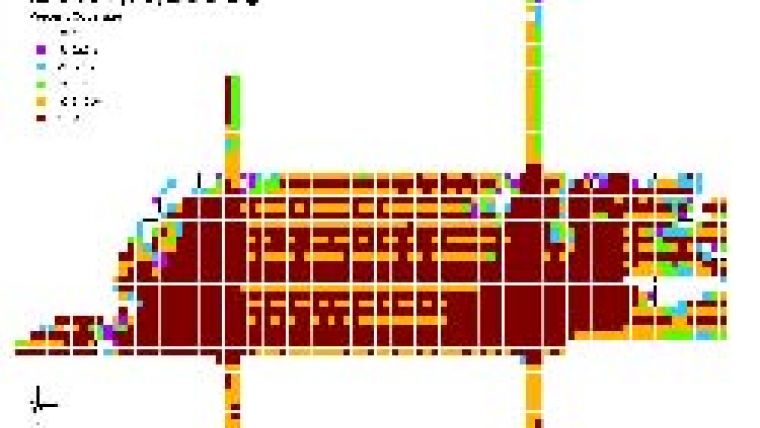
We use the Western Port Bay case study site to illustrate the application and interpretation of the tile coverage method. Figure 2 shows the results of this analysis, where each small square represents a tile and the colour coding is used to indicate the percentage of successful soundings in each tile. Plotting the coverage tiles as shown above provides a convenient means of visually assessing the success of a bathymetric Lidar survey. Gaps in the data, where coverage per tile is <50%, can be identified as the white tiles. Table 2 lists the percentage of tiles meeting various coverage-per-tile criteria.
Integrating Data
There are many issues in the integration of topographic and bathymetric LiDAR data. The data generated by each system have a number of differences that must be understood and resolved in order to combine the data, and create a seamless and dependable DEM. The overlap between the bathymetric (Figure 3, left)) and topographic LiDAR data sets is shown in Figure 4.
One of the key advances in the development of bathymetric Lidar systems is the ability to survey across the littoral zone through the acquisition of near-shore topography and bathymetry with a single system. This capacity raises the question of why bathymetric Lidar technology is not used more often to survey terrain above the waterline. To answer this question, it is necessary to examine the differences between topographic and bathymetric Lidar systems (Table 3).
Integration Challenges
Perhaps the most significant issue in the context of data integration relates to the establishment of a consistent and unified vertical datum. Heights (depths) for the bathymetric Lidar data are referenced to the mean sea surface at the time of the survey. This is subsequently referenced to the height of the tide at the closest tide gauge and therefore to the Australian Height Datum (AHD). AHD heights from the topographic LiDAR survey are, however, derived by applying a local geoid model to the ellipsoidal heights derived from the onboard kinematic GPS solution. The use of different methods to establish AHD heights results in vertical datum inconsistencies, leading to problems when integrating the data to create a unified DEM across the littoral zone.
Five Issues
In addition to the vertical datum inconsistency, there exist other issues that also impact on the task of data integration. While the establishment of a consistent vertical datum poses a significant challenge, other issues also impact on the task of data integration.
- Narrow overlap: invariably, the topographic and bathymetric data sets have minimal overlap. In practice, this overlap can be maximised by collecting topographic LiDAR data at low tide and bathymetric data at high tide. However, the breadth of the overlap zone will be relatively narrow, making the integration process inherently weak in a geometric sense.
- Data gaps: both the topographic and bathymetric data sets contain gaps in the foreshore region. In the topographic case, these gaps are generally caused by pockets of shallow water left by receding waves and/or tide. The bathymetric LiDAR system invariably leaves gaps in very shallow water, caused by difficulties in distinguishing between the bottom and surface reflections of the laser at depths of <0.3m. Data gaps can be problematic if they impose the need for extended areas of interpolation and/or extrapolation.R
- Resolution: because of the different technical requirements of bathymetric and topographic LiDAR systems, they acquire data at different spatial resolutions. Typically, a topographic LiDAR system will have an average point spacing of 1m, whereas bathymetric systems tend to operate at 5m spacing. These different resolutions further complicate the integration process.
- Lack of height control: it is not common to find reliable ground control in the foreshore region.
For this reason, establishing true heights from the two overlapping LiDAR data sets can be difficult. Not knowing which data set is closest to the truth makes it hard to develop a strategy that will yield an accurate integrated DEM. - Data noise: in the Port Phillip Bay case study, the standard deviation of the height differences between the two data sets ranged from ±0.3 to ±1.2m depending on the foreshore terrain. Any integration technique will need to take account of the variable relationship between the two data sets and their relative quality. Normally, more weight would be given to the topographic data in this process, as such data are inherently more precise.
Concluding Remarks
Gaps in bathymetric Lidar surveys can occur for a number of reasons. Data gaps in shallow and deep water consistently occur in each case study area. However, the degree to which turbidity influences the data gaps is highly variable and sometimes unpredictable. It is clear that topographic and bathymetric Lidar data cannot be readily integrated for several reasons. Further investigation must be undertaken if a rigorous solution is to be implemented.
Acknowledgements
The research could not have been conducted without the significant assistance of Tenix LADS Corporation and AAMHatch Pty Ltd. Thanks are also due to Christina Ratcliff.
More Information
-
Quadros, N.D., Collier, P.A., 2008. Delineating the littoral zone using topographic and bathymetric LIDAR. ABLOS Conference, 16-17 October 2008, Monaco.
-
Quadros, N.D., Collier, P.A., 2008. Bathymetric LIDAR performance in shallow coastal waters. Proceedings of the 16th European-based Biennial of the IFHS, 4-6 November 2008, Liverpool (UK), 3, 1-11.
-
Quadros, N. D., Collier, P.A., Fraser, C.S., 2008. Integration of bathymetric and topographic LIDAR: A preliminary investigation. Proceedings of the XXI Congress for the International Society for Photogrammetry and Remote Sensing, 3-11 July 2008, Beijing (China), 1299-1304.
|
Factor
|
Recommendations
|
|
Turbidity
|
Where possible, collect data during periods of low turbidity (e.g. summer, calm weather, low river discharge, low swell) and, if feasible, fill gaps by re-flying at a different time under different conditions (e.g. on the flood tide, which brings clean water inshore) |
|
Shallowness
|
Collect data in shallow areas at high tide. Repeat these areas at low tide if gaps persist and consider flying at low tide with topographic LiDAR if coverage is critical |
|
Depth
|
Do not rely on measuring bathymetry beyond ~30m depth under normal conditions. In water >30m deep and where coverage is critical, select flight times to optimise water penetration (e.g. fly at night if possible) |
|
Fixed obstructions |
Cannot be avoided |
|
Mobile obstructions |
Re-fly the area once the obstruction has moved |
|
Sea floor type
|
In areas of shallow water and low sea floor reflectivity, survey at high tide to maximise the separation between the surface reflection and the bottom reflection |
|
Weather impact
|
Allow the contractor to manage the selection of the survey site on a particular day so that areas affected by poor weather can be postponed |
Table 1: Recommandations for optimising the effectiveness of a bathymetric Lidar survey
|
Criteria (%) |
100 |
95 |
85 |
75 |
65 |
|||||
|
Tiles |
No. |
% |
No. |
% |
No. |
% |
No. |
% |
No. |
% |
|
1,851 |
1,175 |
63 |
1,478 |
80 |
1,595 |
86 |
1,659 |
90 |
1,712 |
92 |
Table 2: Number and percentage of titles that meet each coverage criterion.
|
Category
|
Topographic LiDAR (Optech ALTM 3100EA) |
Bathymetric LiDAR (LADS Mk II) |
|
Hardware specifications
|
Pulse rate: <100kHz; near-infrared laser; lower power laser can take more measurements per second, generally surveys using ~1m point spacing |
Pulse rate: <1kHz; green and near-infrared laser; higher power laser results in fewer measurements per second, generally surveys use ~5m point spacing |
|
Flying height |
800-2,200m |
366-500m |
|
1s vertical accuracy |
±15cm at 1,100m altitude |
±50cm bathymetry and ±1m topography |
|
Horizontal accuracy |
±1/3,000×altitude (typically better than 0.6m) |
±5m |
|
Vertical datum |
GPS heights; geoid model used in computations |
No geoid model; established from local tide gauges |
|
Resolution |
1-2m |
2-5m |
|
Footprint |
0.24m at 1,200m altitude (narrow beam); 0.96m at 1,200m altitude (wide beam) |
2-3m |
|
Swath |
800-2,184m; swath = (0-0.93)×altitude (m) |
50-300m; independent of altitude |
|
Data processing |
Lower costs per area; first return used to define vegetation and building height; last return used is for ground height |
Costs anywhere up to 5 times higher per area; least depth criteria adopted; first return is used to define terrain height |
Table 3: Differences between topographic and bathymetric Lidar systems.

Value staying current with hydrography?
Stay on the map with our expertly curated newsletters.
We provide educational insights, industry updates, and inspiring stories from the world of hydrography to help you learn, grow, and navigate your field with confidence. Don't miss out - subscribe today and ensure you're always informed, educated, and inspired by the latest in hydrographic technology and research.
Choose your newsletter(s)


