Automated Depth Area Generation for Updating NOAA Nautical Charts
NOAA’s Marine Chart Division (MCD) is currently revising production efforts using an ‘ENC-first’ approach to provide seamless and tiled geographic coverage. Currently, ENC production workflows within MCD require cartographers to manually manipulate data in the Nautical Information System (NIS) to update navigation products. This MCD addressed this production bottleneck by developing a tool to derive depth area, contour and sounding vector data directly from gridded raster bathymetry surface data.
Production of Electronic Navigational Charts (ENCs)
Over the past decade, automation of data compilation procedures within National Oceanic and Atmospheric Administration’s (NOAA’s) Office of Coast Survey (OCS) and MCD (responsible for updating nautical charts), has become crucial to efficiently update and distribute nautical information to the public. In the current workflow, MCD ingests a variety of data (e.g. hydrographic, aids to navigation, bridges, pipe and cable information, and landmarks) from numerous providers including state and federal agencies, as well as international agencies. All this information is retained in the NIS - a GIS used to create navigation products for the marine public. To keep the NIS up to date, and due to the nature of the data sources, it is important that updates to nautical charts are applied as soon as possible. However, this can be particularly difficult due to the volume of information being processed. Additionally, manual updates to the NIS can require slow, repetitive and error-prone production processes. Over the past year, MCD has implemented a re-scheme approach that will improve the overall charting suite through changes to chart formats, scales, data compilation, and symbology. Six new usage bands and their twelve compilation scales will conform to IHO S-57 and the majority of S-101 ENC format specifications. Regardless of the quantity of scales, larger scale charts will display greater detail than smaller scale charts.
Production Goal: Workflow Enhancement
The focus of this paper is workflow enhancement for ingesting bathymetry data. The goal of this effort is to increase efficiency of MCD’s production by incorporating automated data-processing methods into nautical chart production. Regardless of whether incoming bathymetry is manually or automatically processed, all data must be scaled to fit MCD standards. Nautical charts are produced at varying scales, which are intended for different uses. The new gridded ENC coverage approach reduces the number of current chart scales from 131 to 10 unique scales. This concept of generalisation is intrinsic to the field of cartography and propagates through the data-processing methods necessary to update scaled digital maps.
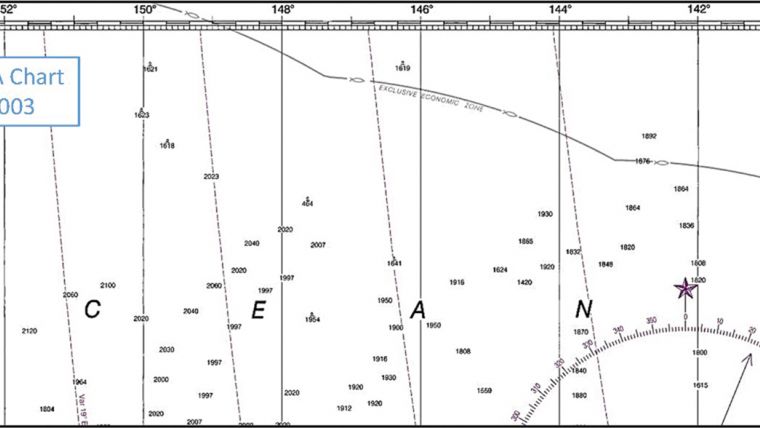
Chukchi Plateau
The Chukchi Plateau is a submarine elevation extending north from the continental shelf of the United States into the Arctic Ocean. Charting products in this area are required under the United States extended continental shelf programme. Current nautical charts over the offshore areas near the Alaskan North Slope are at scales of 1:700,000 and 1:1:587,970 (NOAA Charts 16003, 16004, and 16005). Depth information is limited on these charts and even contain soundings with ‘no bottom detected’ that were collected during the 1930s or earlier (Figure 1). Updating depth information on these charts requires the use of bathymetry surveys that were not collected by NOAA hydrographic survey vessels.
Over the past 15 years, the US Extended Continental Shelf (ECS) surveys included high-resolution multibeam sonar surveys in the region north of the Alaskan north-slope margin and on the Beringian margin. The data is also included in the digital bathymetry database of the International Bathymetric Chart of the Arctic Ocean (IBCAO) initiative. The availability of these datasets and the current state of bathymetry information over Chukchi Plateau illustrates the opportunity for the MCD to update lacking information using ESC surveys for soundings and IBCAO grid for depth areas and contours (Figure 2).
Results
The IBCAO bathymetry data was processed with MCD’s depth area tool to generate depth area, contour, and sounding features at a scale of 1:640,000 (Figure 3). The output data are topologically correct in that depth areas do not overlap, contours do not collapse on themselves, and soundings are located on the correct side of the contours. Furthermore, the outputs are properly attributed and contain the NIS database schema, which allows cartographers to load the vector features back into the database without the need to reformat or digitise individual features. Manual cartographic edits may be required for aesthetics and boundary conditions, however, the workflow for cartographic compilation has greatly improved through the automatic creation and attribution of the nautical vector features. The results of this study over Chuckchi Plateau are currently being processed by MCD to create two ENCs at a scale of 1:640,000 (US2AK1GD and US2AK1HD) that were released in July 2018.
Discussion
The MCD’s depth area tool provides an output that can be immediately incorporated into the chart production workflow. However, challenges remain with efficiently incorporating these types of additional bathymetry datasets into nautical charts on top of the current volume of data being ingested. Furthermore, all incoming bathymetry data to MCD must be internally assessed and assigned data quality classifications based on the instrumentation, provider, and available metadata associated with each survey. This automated depth area generation process allows MCD to update depth information on nautical charts in locations where authoritative sources have not yet surveyed while also informing the public of the quality of bathymetric data in the area. Automating portions of the workflow for updating nautical chart depth information is an effective means to increase efficiency and reduce human error, thus allowing the MCD to keep nautical products as accurate and up to date as possible. This tool has greatly reduced the production time for new Arctic charts. These chart products follow the new ’ENC first’ approach in providing a seamless transition between charts within the same usage band. As such, this automated depth area generation tool and other automated workflows are being incorporated into chart production to process larger amounts of data over shorter periods of time. These new nautical chart production practices will mitigate the issue of timely updates to bathymetry data in the NIS, and in turn, provide better navigation data to the marine public.
--------------------
References
Jakobsson, M., N.Z. Cherkis, J. Woodward, R. Macnab, and B. Coakley. New grid of Arctic bathymetry aids scientists and mapmakers; Eos, Transactions, American Geophysical Union, v. 81, no. 9, p. 89, 93, 96. (https://doi.org/10.1029/00EO00059)
Office of Coast Survey, 2017. National Charting Plan A Strategy to Transform Nautical Charting. NOAA technical report, November 1, 33 pp.

Value staying current with hydrography?
Stay on the map with our expertly curated newsletters.
We provide educational insights, industry updates, and inspiring stories from the world of hydrography to help you learn, grow, and navigate your field with confidence. Don't miss out - subscribe today and ensure you're always informed, educated, and inspired by the latest in hydrographic technology and research.
Choose your newsletter(s)


