Backscatter - From Ping to Database
A Canadian Hydrographic Service Perspective
The Canadian Hydrographic Service (CHS) is willing to make better use of the backscatter intensity data collected with their multibeam sounding systems. All the backscatter data collected during the last 2 decades were not systematically processed and maintained, so a lot of valuable information has not been used yet and is archived on tapes and disks. The intent of CHS is to make an inventory of this data and to process it to a minimum level so that it can be made accessible to its cartographers and to the scientific community. Backscatter information can be a valuable piece of information for traditional chart production, habitat mapping and in many other fields of activity where substrate type is a variable. This article describes a potential dataflow with the Caris suite of software which may serve as a guideline for future processes and tool development related to backscatter data. At a time when resources are increasingly limited, the treatment of backscatter is not the highest priority for CHS, but the development of this concept will allow CHS to be ready if new resources become available.
Full traceability of soundings is possible especially with all the efforts put in place to digitise and integrate these soundings into CHS bathymetric database. That project was put in place some time ago and is well underway. For backscatter the story is quite different since it was considered a by-product of multibeam bathymetry. Very little effort was given to managing and using this information. Every new request for backscatter data is a reminder of the work we should do to get better organised. Going back to data inventories and digging tapes from different projects is time consuming and frustrating when compared to the efficiency with which we can now answer a bathymetry request. Bathymetry and nautical products are the core businesses of CHS, and for its internal purpose CHS needs a basic seafloor classification in order to integrate bottom types to its products, but client needs can span from raw backscatter data to higher levels of processing. It is not within the actual CHS mandate to create specific habitat classification, but CHS collects the data and wants to make it available to the community.
The first step to address is to bring back all raw backscatter information and organise it in a manner that the information can be retrieved using geographical queries rather than finding and managing the content of projects. Disk space will be a challenge and the query interface must be user friendly with a potential to access this data online at some point in time. This is not the most exciting step to address but having data well organised will pay off in the future. Because of its involvement in a similar process for bathymetry, CHS knows the significant level of effort needed to reach that goal.
Backscatter Processing
The processing of backscatter data signals has been in constant evolution and some concepts are promising. Many research papers exist on the subject and software manufacturers have implemented some of the science developed in the last 10 years. The backscatter processing leading to the creation of backscatter mosaics is quite different from the bathymetric processing workflow. With a national bathymetric data processing procedure using the CUBE algorithm, CHS has a fully integrated procedure and dataflow for depths processing. The hardest decisions regarding backscatter are the choice of processing technique and the end results. The same process must be used for all our datasets and the result should be good enough to answer the needs of the majority of clients that require signal intensity returns from multibeam sonars. To address the needs of a broad community, it is necessary to develop a general workflow that is well documented. From the result of this process, clients may use algorithms adapted to their specific needs. For Hydrographic Organisations, the usual mistake is to try to deliver bottom classification to specific clients. Backscatter data can be used for various purposes with results varying with the needs to such an extent that it becomes difficult, if not impossible, to satisfy all users. For example, just in terms of resolution, some users may want to classify sand wave fields while others may be interested in classifying the crest and trough of the dunes. To answer most of the clients’ needs, the ‘CHS’ processed backscatter will be an intensity image and any valuable information (roughness, etc.) with most of the artefacts removed at the best spatial resolution achieved by the sonar system, which normally correspond to the bathymetric surface resolution, i.e. the insonified footprint.
Managing Processed Backscatter
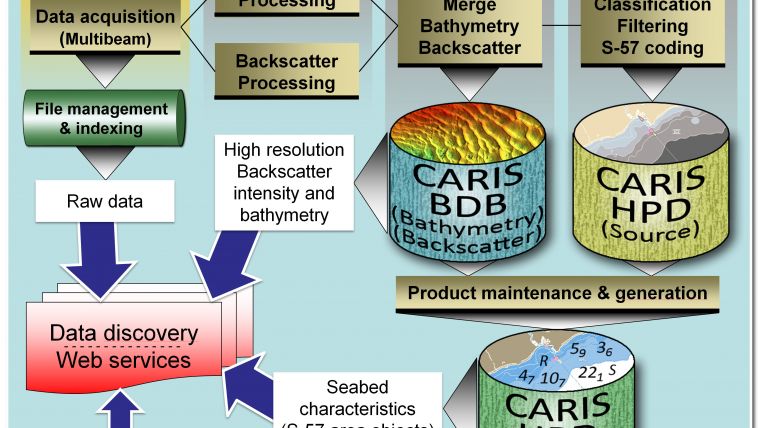
Bathymetry and backscatter are strongly linked because they come from the same source. Each information type is processed independently but it is possible to merge the backscatter intensity mosaic to the bathymetric surface using the benefits of Caris CSAR framework. CSAR framework was designed by Caris to handle large volumes of multi-dimensional and multivariate data. Indeed the image can be loaded as a layer where it can be displayed and manipulated just like all other typical CSAR layers (depth, standard deviation, uncertainty, etc.). Having the high definition bathymetry collocated with the backscatter intensity gives interesting display and analysis possibilities. The main benefit of storing the intensity image in Caris BathyDatabase is to have access to the data management capabilities of Caris BDB. This technology is used daily by CHS hydrographers to access and disseminate bathymetric information so why not extend its use by integrating backscatter data. Using this software technology enables CHS to publish information on the Web for data discovery. If it is possible for bathymetry why not maximise the use of the tool and put the backscatter in there also.
Basic Seafloor Classification for CHS Products
On Canadian Hydrographic Service charts, bottom types come mainly from old seafloor grabs and samplings. A minimal effort has recently been put into collecting samples. With decreasing resources, the focus was on bathymetry only and sampling the bottom is always the first to be cut when survey time is limited. With the latest survey software, quick processing on board survey vessels can reveal the seafloor hardness. It is then possible to collect samples at a few significant spots based on this processing as opposed to the traditional systematic approach where many samples were collected at regular grid spacing. In fact, with only a few samples overlaid on the intensity image it is possible to define a basic supervised seafloor classification that can later be portrayed on charts.
From Punctual Samples to Seabed Area (SBDARE) Objects
One objective of the backscatter intensity data processing and management is to find a way of bringing backscatter layer information on the official CHS products. In the CHS chart production system (based IHO S-57 codification), the nature of surface (NATSUR attribute) can be extrapolated from the Basic Seafloor Classification in the form of generalised seabed area objects SBDARE. These areas can currently be digitised manually, but CHS would like new tools to automatically create seabed areas. The result of this process would be a series of classified seabed areas stored in the CARIS HPD source database and available for the final products. Official charts will benefit from this approach with enhanced information relative to bottom type.
One Source, Many Usages
Backscatter can be useful to a wide spectrum of activities. The CHS perspective is designed to address the specific needs of many clients. The research community wants to start from the raw backscatter data in order to develop complex processing strategies using algorithms that need to incorporate data only accessible in raw sonar files. The general habitat mapping community will most likely use the backscatter intensity image combined with the high definition bathymetry to help understand the ecosystems and the relation with the living species. Finally, CHS needs to incorporate bottom type information on its products and use the polygons derived from a basic bottom classification and samples. Polygons will be managed in CARIS HPD database where this source information will be used to create ENCs, raster and paper charts.
Conclusion
With the increase of backscatter data collected by a range of sounding systems, this approach would help CHS significantly improve its backscatter data management and accessibility. Backscatter would be systematically processed and used in chart production systems as area objects instead of point features, which would be a giant leap in hydrographic seafloor characterisation practices. This workflow would remain valid when calibrated backscatter data becomes available. CHS will work toward this goal and make sure that all those valuable returns from the pings are brought into its databases and products.
More Information
- The Hydrographic Society of America, CSAR: A new way forward with high volume bathymetry, thsoa.org/hy09/0514A_04.pdf
- US Hydro, 2011, Poster, Backscatter "from Ping to Databases": A Canadian Hydrographic Service Perspective, Roger Côté, Louis Maltais, Richard Sanfaçon,Canadian Hydrographic Service. http://www.thsoa.org/us11papers.htm#7
- Hydro 12, Proceedings, Cote, Rogerand Maltais, Louis and Sanfaçon, Richard (2012) Backscatter: ”From Ping to Database”, a Canadian Hydrographic Service perspective. http://proceedings.utwente.nl/222/
Louis Maltais has been working for the Canadian Hydrographic Service (CHS) for 15 years. He is involved in numerous R&D projects, implementing solutions to improve productivity, efficiencies and better meet the clients’ needs.
Roger Côté has been a supervisor in data acquisition and chart production within CHS for 28 years. He is involved in the definition and implementation of bathymetric and cartographic processes to enhance the efficiency and quality of CHS source data and products.
Richard Sanfaçon has been working for the Canadian Hydrographic Service for 33 years. He is manager of the Quebec Region’s Hydrographic Operations, responsible for hydrographic surveys and marine charts production.

Value staying current with hydrography?
Stay on the map with our expertly curated newsletters.
We provide educational insights, industry updates, and inspiring stories from the world of hydrography to help you learn, grow, and navigate your field with confidence. Don't miss out - subscribe today and ensure you're always informed, educated, and inspired by the latest in hydrographic technology and research.
Choose your newsletter(s)


