Characterisation of the Nigerian Shoreline
using Publicly-Available Satellite Imagery
Current methods of shoreline mapping include aerial and high-resolution satellite imagery and ground-based surveying, all of which require considerable investment of human and material resources. Mapping and continuous updating of the shoreline for developing countries, such as Nigeria, is a challenge. Most of the information on the Nigerian shoreline is based on ‘surveys of opportunity’ performed by various government agencies over a wide time span. Additional surveys conducted by the multi-national oil and gas companies exploring in the region are typically not available for use by government agencies. In cases where the data are available, the variety in methods used for shoreline mapping can result in inconsistencies.
The goal of this study was to develop a procedure for mapping and characterising shorelines using publicly-available satellite imagery in a GIS environment. Spectral analysis and image processing algorithms were used to define the land/water boundary and characterise the coastal area around the shoreline. The satellite-derived shorelines were compared to well-charted shorelines for adequacy and consistency evaluation. The satellite-derived shorelines were also compared to shorelines from historical maps to identify any changes between the datasets.
Shoreline Position and Character
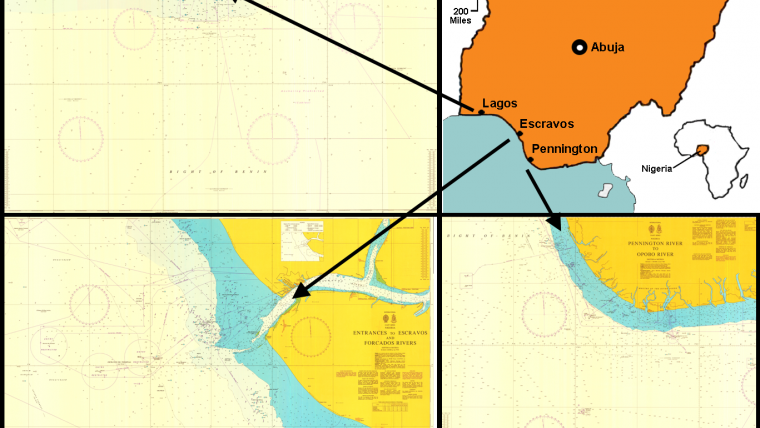
The Nigerian shoreline lies in the West Coast of Africa (Figure 1) and is part of the Gulf of Guinea. The Nigerian shoreline is typically classified into one of the four major coastal groups: barrier island coast, mud coast, Niger Delta coast and the strand coast. The character of the shoreline can be used as an indicator for coastal management. In addition to the geological characterisation, the International Hydrographic Organization (IHO) provides a description of shoreline characteristics and the corresponding symbols and features used on a nautical chart. The shoreline position is marked on the chart at a selected vertical datum, typically a tidal datum. The shoreline character symbols and features vary between charting organisations, but can generally be divided into three main cartographic groups: natural, manmade and undefined.
In Nigeria, the current navigational charts are produced by the United Kingdom Hydrographic Office (UKHO) (Figure 1). Three Admiralty Charts at a scale of 1:350,000 cover the whole Nigerian coastline and only a few key locations (e.g., Lagos and Escravos) are covered by charts at scales larger than 1:80,000. The horizontal datum of the UKHO Admiralty charts is WGS 84 (original realisation), and a Transverse Mercator map projection is used. The vertical datum to which soundings are referenced is the Lowest Astronomical Tide (LAT), while heights and the shoreline are referenced to the Mean High Water Springs (MHWS).
Shoreline Mapping and Characterisation Procedure
The mapping and characterisation of shorelines using multi-spectral satellite imagery was performed in a GIS environment. Key steps in the procedure include: pre-processing, land/water separation (shoreline delineation), water subset analysis (man-made features and bathymetry) and land subset analysis (vegetation and exposed land). Landsat 7 imagery was used for mapping the position and character of the shoreline. The major consideration in selecting Landsat imagery was the availability of suitable multispectral datasets at no cost for many coastal areas around the world.
Three Nigerian sites were selected based on their coastal characteristics, national priority for mapping and availability in nautical charts and topographic maps. The Lagos study site is a barrier coast type shoreline with man-made features on both sides of the Lagos inlet. The Lagos study site has sparse vegetation, typically shrubs and short grass. Escravos and Pennington are located in a Niger Delta coast type shoreline: a densely vegetated area composed mainly of mangrove and tall shrubs. The vegetation in both sites does not extend to the low water line except within the channel where the water is usually calmer. Man-made features (moles and oil rigs) are also present in the Escravos study site.
To assess the suitability of the methods developed in this study, the procedure was first conducted using a calibration site located along the northeast coast of Massachusetts in the United States, between Merrimack River and Cape Ann. The criteria for selecting this site included the availability of remote sensing survey data that can be used as reference datasets. The site also contained shoreline characters similar to the Nigerian study sites, in addition to rocky outcrops. Although the data for the calibration site is from a NOAA chart, the chart symbols are similar to those of the UKHO charts of the Nigerian sites. The procedure included a decision tree (Figure 2) that: a) classified the images into land and water (level 1), b) characterised the dry land into exposed, vegetated and man-made classes (level 2), c) calculated bathymetry for the submersed areas (level 2), and d) assigned an attribute to different segments along the shoreline character (level 3).
Comparison Results
The satellite shoreline position results for the US calibration site showed a good agreement with the MHW shoreline depicted on NOAA charts. NOAA archive tidal stage information indicated that the Landsat image was acquired at a high stage of tide. Next, a qualitative cartographic comparison over the Nigerian study area was conducted. In Lagos Channel, visual agreement in shoreline position was observed between the satellite-derived shoreline and the charted MHWS shoreline. In the Escravos study site, cartographic comparison also shows good agreement between the charted shoreline and the satellite-derived shoreline along most of the coast. It is important to note that MHWS and LAT shorelines in the Escravos study site are almost coincident over their entire length. This can be attributed to the relatively steep beach slope in the area and the 1:60,000 scale of the chart used in the comparison. In the Pennington study area, only a single MHWS shoreline is depicted on the chart because of the chart scale (1: 350,000). The Landsat shoreline agreed well with the charted shoreline.
A thematic comparison was also made between the Landsat-derived shoreline and other sources. High-resolution satellite imagery (IKONOS) was used to validate that the separation of vegetated areas from exposed areas was successful using Landsat over the US calibration site and Escravos. The Landsat imagery provided more details on the shoreline character than the available charts and maps (Figure 3). It was possible to separate the vegetation and exposed shoreline into more classes, however, the symbols on the charts were not detailed enough to validate the results. In addition, a submerged mole was identified using satellite derived bathymetry and validated using the reference (Figure 4).
Based on consideration of the nominal georeferencing accuracy and resolution of the Landsat 7 imagery, the lack of tide information, and the method of shoreline extraction, the estimated positional uncertainty of the shoreline in all three Nigerian sites (Lagos and Pennington) is ~150-200 m at 95% confidence level. Cloud cover in some of sites limited the comparison areas. Ground truth is required to evaluate the results and determine the threshold between various land covers and vegetation types.
Conclusions
The characteristics of a shoreline are indicative of potential changes that can occur in the position of that shoreline, as well as coastal development. Unfortunately, many developing countries are not able to map their shorelines on a frequent basis due to limited resources. This procedure offers a solution to this challenge using free and publicly-available data. Although, the shoreline characterisation procedure was developed based on datasets from study sites along Nigerian coastline, the procedure is suitable for mapping coastal areas in other developing regions. Investigation of more study sites with ground truth data as a controlled reference will provide a more robust procedure that can include various land covers and vegetation types.
Acknowledgements
The authors thank Dr. Lee Alexander and Dr. Chris Parrish for their contributions to this study. Also, they thank NOAA and the UKHO for the permission to use their charts for this study.
More Information
- International Hydrographic Organization (IHO), 1994, Publication S-32, Hydrographic Dictionary, Monaco, 5th edition, 280p.
- International Hydrographic Organization (IHO), 2012, Publication S – 4, Regulations of the IHO for International (INT) Charts and Chart Specifications of the IHO, Edition 4.3, Monaco.

Value staying current with hydrography?
Stay on the map with our expertly curated newsletters.
We provide educational insights, industry updates, and inspiring stories from the world of hydrography to help you learn, grow, and navigate your field with confidence. Don't miss out - subscribe today and ensure you're always informed, educated, and inspired by the latest in hydrographic technology and research.
Choose your newsletter(s)


