Hydrography After Huge Earthquakes
Hydrographic Activities in the Aftermath of the Earthquake and Tsunami Disaster in Japan
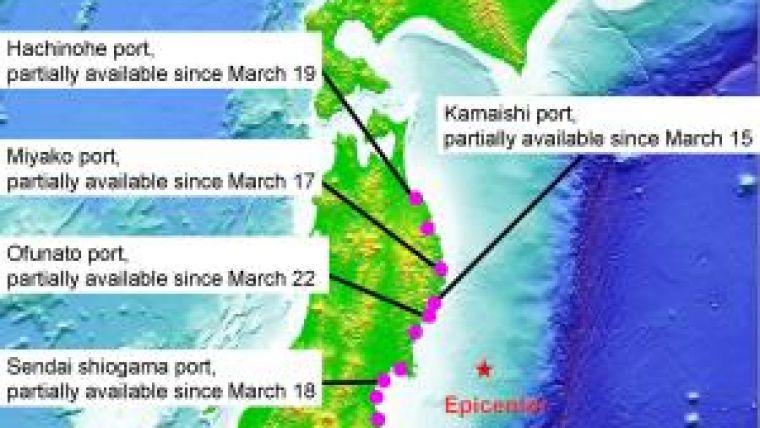
An earthquake of unprecedented magnitude hit the east coast of Japan on 11 March 2011. A tsunami, a large wave caused by the earthquake, crashed into the ports and coastal regions, flowing into the mainland and sweeping away everything in its path. The Japan Coast Guard performed intensive hydrographic surveys immediately after the earthquake so that ports and harbours could be opened as soon as possible. Co-operation with local port authorities in the early stages was crucial for removing dangers in the harbour passages promptly. These experiences have shown that hydrographic activities after huge earthquakes are indispensable for safety of navigation and opening ports rapidly to expedite recovery of the local economy.
On 11 March 2011, a devastating earthquake (magnitude 9.0), by far the largest in recent Japanese history, hit the east coast of Japan (Figure 1). It was followed by an unprecedented huge tsunami, that had a maximum run-up height of 40m and spread wide (inundated area: 561 square km) and penetrated deep (6km from the shoreline). The tsunami surge was extremely powerful, completely destroying most of the facilities in the affected coastal area; jetties, ships, harbour facilities, houses, tanks, warehouses and factories were left in ruins. Japan has experienced a number of tsunamis in its history, but never one this large. Therefore, although the port authorities had prepared for the tsunami by constructing jetties large enough to block waves of an expected scale, their expectations were too conservative.
As of 26 July 2011, it was announced that 15,636 people had been killed and 4,808 people were still missing. Most of these people have been identified as victims of the tsunami surge. In the immediate aftermath of the earthquake, more than 400,000 people who had either been left homeless, or with uninhabitable accommodation due to flooding or lack of amenities, took refuge in school facilities or city halls. Gas, oil, water, and food shortages were a serious problem in the damaged cities, and reestablishing water transport links was vital for alleviating these shortages.
Hydrographic Activitities
As a result of the tsunami surge, many ports and harbours in the east coast of Japan were significantly damaged: jetties and lighthouses were destroyed, objects submerged, debris, such as fishing nets, were set adrift, and there was variation of seabed topography due to erosion and sedimentation. In particular, sunken objects were a danger to vessels and needed to be removed. A prompt hydrographic survey was vital in helping mariners guide their vessels into the ports (Figure 2).
Significant ground subsidence was observed in many of the damaged ports. For example, a 1.2m subsidence was found at Onagawa port, which was the nearest port to the epicenter of the earthquake. As a result of the subsidence, the coastline has been changed extensively and chart datum has had to be re-determined. Since the disaster, more than 800 navigational warnings (NAVAREA, NAVTEX, and local warnings) have been issued of earthquakes and potential tsunami, drifting objects, problems with navigational aids, and restrictions in harbours. With a large number of floating objects being observed after the earthquake, navigational warnings were especially important for vessels navigating off the east coast of Japan. These warnings were the only source of information for navigators in the first few weeks, and we had to be careful in selecting which information to issue from the vast amount of data collected. One of the most urgent and essential activities, as a consequence of the hydrographic survey, was to open ports and harbours so that relief materials could be delivered to the refugees. Therefore, directly after the earthquake, we dispatched five survey vessels - all those available - to assess the damaged ports.
First Stage Survey (March to April 2011)
The purpose of the first stage survey was to reopen important berths as soon as possible. To do this we needed to ensure the following: 1) identify potentially dangerous obstacles along the harbour passage and in the proximity of the berths, 2) remove these obstacles in co-operation with the port authorities, and 3) confirm the minimum depth of the ocean floor at low tide for navigators. It should be noted that this stage is necessary only when a significant number of obstacles have been observed.
We managed to make a general strategy for the disaster quickly enough, because we already had plans to prepare for typical earthquake disasters showing the activities that we should undertake just after disasters, for example, how many and from where vessels and survey instruments should be deployed. However, we had to expand the scope of the surveys because the earthquake was much larger than expected.
We also had to decide on the order of priority of the berths to be surveyed based on requests or information from local governments and the regional headquarters of the Japan Coast Guard which are responsible for the damaged area.
At this stage, both side-scan and interferometric sonar devices were useful tools for determining potential dangers (Figure 3). Single-beam and multi-beam echo sounders were also used to measure the depth of the highest point of obstacles. Lists of the dangers in surveyed areas were drawn up every evening (Figure 4) and reported to the port authorities. The port authorities could then remove obstructive objects depending on the risk (Figure 5).
First stage activities were dangerous and difficult to perform because of the many drifting fishing nets and wires floating in the ports. These nets and wires, used for the culture of oysters, scallops and sea weeds, could easily become entangled in the propellers of boats and ships. As a result, an operation conducted with divers from the Maritime Self-Defense Force to remove drifting objects enabled the survey to be carried out effectively and safely under dangerous circumstances.
Drift prediction was also important in the first stage. There were a number of floating objects that were serious hazards to seafarers, including missing fishing boats that the owners hoped to recover. These objects were observed from airplanes and vessels, and we calculated their trajectory by using wind and ocean current data so as to help people avoid them or find them.
The following is an extract from an interview conducted with one of our staff members, Mr.Saegusa, hydrographic survey officer and one of the authors, who struggled to carry out hydrographic surveys at severely damaged ports:
"I was already aboard the survey vessel Kaiyo (550t, 60m in length) on 12 May, heading to the damaged northeast part of Japan. Of course, no crew members had time to say goodbye to their families before their departure. Our vessel had two pieces of equipment, a multi-beam echo sounder for the main vessel and an interferometric sonar device for the small survey boat (9.6m in length) attached to the Kaiyo. An interferometric sonar device is a side-scan sonar system with an additional function for sounding depth by measuring the phase of the sound wave. We surveyed two ports (one in full and a part of the other) for one week in the first survey cruise. By the time we got to Kamaishi port, I realised the terrible power of the tsunami, having seen that the world's deepest breakwater (more than 50m high from the seafloor) had collapsed. I have to say that we were always anxious about aftershocks and a tsunami striking during the survey activity. We were able to survey a wider area using the interferometric sonar device than with the multi-beam echo sounder, and this helped us to find obstructions within a shorter time."
"Just after the earthquake, there were many difficulties in performing our survey activities. The tsunami had made the water muddy, and this seemed to make sound signals so weak that I had to control the receiver gain more precisely than usual. The tremendous number of floating objects on the sea surface also disturbed our activity. It was really dangerous to navigate in such an area. Actually, in mid-March, one of our survey boats became entangled in fishing nets twice in one day. We, therefore, needed divers on each survey vessel/boat to get rid of them. To avoid these objects, the survey track lines had to wind around them, and the severe rolling and pitching of the ship meant that the collected depth data were not good. Our work became even harder when we were suffering from low temperatures, especially when it was snowing. It was really cold for those working outside on the ship's deck and watching for floating objects. Even when we were in adverse conditions, we couldn't stop our survey activity, as people were waiting for supplies to be delivered by sea. I was really happy to hear the news that the first vessel transporting supplies for the refugees had entered Kamaishi port, two days after our survey."
Second Stage Survey (from May 2011)
After the first stage survey, we needed to move on to the next stage, to collect precise hydrographic information for safety of navigation. The purpose of the second stage of surveying was to update nautical charts. We performed the following: 1) determined chart datum from tidal observations; 2) performed a hydrographic survey in ports and harbours to measure water depth and evaluate the coastlines; and 3) published new-edition nautical charts or small charts.
Tide correction and vertical sound velocity profile correction are required to obtain precise depth data for nautical charts. However, it should be noted that most of the tide gauge stations in the ports hit by the disaster were destroyed and that reference points on the quays were not available. Therefore, it was necessary to set up tide observation equipment for about one month, in order to determine the chart datum and mean sea level. This chart datum is also needed by the port authorities so that they can repair and reconstruct damaged ports. Airborne light detection and ranging (Lidar) is an effective means for undertaking hydrography in shallow waters along coastlines. It can measure to a depth twice that of the transparency of the sea water. We started taking airborne Lidar observations to survey the shallow waters and natural coastlines in the affected regions (Fig. 6).
Closing Remarks
At the time of writing, four months after the earthquake, there still remains a substantial amount of destruction. It is expected that it will take several years to fully repair and reconstruct all of the damaged ports and harbours, and completion of the second stage of our activities is still a long way off.
The role of hydrography after a huge earthquake and tsunami surge is to provide information to open ports as soon as possible, which is critical for transporting supplies to refugees. Knowing the most up-to-date condition of ports and harbours, which change on a daily basis, gives navigators reliable navigational information and ensures navigational safety. Thus, hydrographic activities are vital for the safe navigation of waters in the devastated areas and will help the recovery of local economies and lead to the rebirth of the east coast of Japan.

Value staying current with hydrography?
Stay on the map with our expertly curated newsletters.
We provide educational insights, industry updates, and inspiring stories from the world of hydrography to help you learn, grow, and navigate your field with confidence. Don't miss out - subscribe today and ensure you're always informed, educated, and inspired by the latest in hydrographic technology and research.
Choose your newsletter(s)


