Increased-resolution bathymetry in the south-east Indian Ocean
MH370 search data
The disappearance of Malaysian Airlines flight MH370 on 8 March 2014 led to a deep ocean search effort of unprecedented scale and detail in the remote south-eastern Indian Ocean. Between June 2014 and January 2017, two mapping phases took place: (1) a shipborne bathymetric survey, and (2) a higher-resolution search in areas where accurate mapping of the seafloor was required to guide the detailed underwater search aimed at locating the aircraft wreckage. The latter phase used sidescan, multibeam and synthetic aperture sonar mounted on towed or autonomous underwater vehicles (AUVs). This article describes the mapping of the area where the aircraft was expected to be found.
The search area covered an arcuate, NE-SW oriented swath of ~2500km long centred on Broken Ridge (Figure 1). When the survey began, the best bathymetric model available was almost entirely (95%) derived from satellite-altimetry data (Figure 2). However, over the search period, ~710,000km2 of shipboard multibeam data (search and transit data), 4,900 line-kilometres of sub-bottom profiler, and over 120,000km2 underwater systems data were acquired. The MBES mapping effort resulted in the largest seafloor coverage acquired for the Indian Ocean, approximately equivalent to the size of France or Texas. The spatial resolution of the seafloor improved from an average of 100km to 0.1km horizontally and by over 20 times vertically (>100m to ~ 5m). In this article, we focus on the shipborne multibeam dataset and the improvement it has made to the bathymetric and geological understanding of the region.
Bathymetric models of the world oceans and SE Indian Ocean
Topographic models of most of the world’s oceans are based on a combination of data types and resolution, i.e. mainly satellite-altimetry, single-beam sonar, Lidar and multibeam sonar (listed in increasing order of resolution and decreasing coverage availability). The latest global topography/bathymetry model available is the Shuttle Radar Topographic Model plus bathymetry at 15-minute horizontal resolution (SRTM15_plus). The bathymetry portion of this model combines available soundings with interpolated depths based on marine gravity anomalies estimated from satellite altimetry. The satellite-derived bathymetry technique was originally developed because the majority of shipborne acoustic bathymetry data available in the remote oceans, especially the southern oceans, was and still is celestially navigated single beam analogue echo soundings, with large gaps between soundings. These soundings were used and relied upon to calibrate the gravity-to-topography projection algorithm, and thus where these are heterogeneous and sparse, the model accuracy is limited. For example, the soundings available in the broader search area (incl. transits) cover < 5% of the total seafloor area (Figure 1) and include many old and low-accuracy data.
A comparison between the SRTM15_plus and the new MBES model shows that 60% of the SRTM15_plus fall within +/- 100m vertical accuracy, suggesting a one-sigma error in the STRM of ~100m (Figure 3). Considering an average water depth of ~4000m for the area, 100m represents an error of only ~2.5%. This is the best accuracy expected for this model considering that the archival data used to calibrate the mean depth (averaged over roughly 100km by 100km patches) cannot be more accurate than 2.5%. This is due to the uncertainties in the nominal (uncorrected) speed of sound in seawater used to communicate data between institutions (i.e. 800 fathoms versus 1500 m/s). The most vertically accurate areas of the SRTM are located north of Broken Ridge and from 180km west of Australia’s continental shelf break (Figure 3). These areas correspond with sounding tracks utilised to calibrate the model. In contrast, areas of greatest discrepancies (up to 2,400m) occurred around complex features like Broken Ridge and Diamantina Trench. These large errors (>500m), however, occur in less than 1% of the total area and are caused by the combined presence of large escarpments (>1000m; Figure 4) and thick sediment cover (>500m) overlaying the bedrock. These areas thus provide the most striking differences when observing and comparing the MBES model to the global SRTM model.
Geological insight
The new multibeam data reveal the seafloor in great detail and thus offer geological insight into the tectonic and seafloor processes occurring in this remote region. The Diamantina Escarpment, which spans from Broken Ridge to Diamantina Trench and plunges over 5,100m in relief, documents the rifting of Broken Ridge – Kerguelen Plateau (Figure 4). Previous studies found that this plateau, with some microcontinental components (Gulden Draak and Batavia Rises), formed as a contiguous large igneous province (LIP) in Cretaceous time (between 120 and 90Ma).
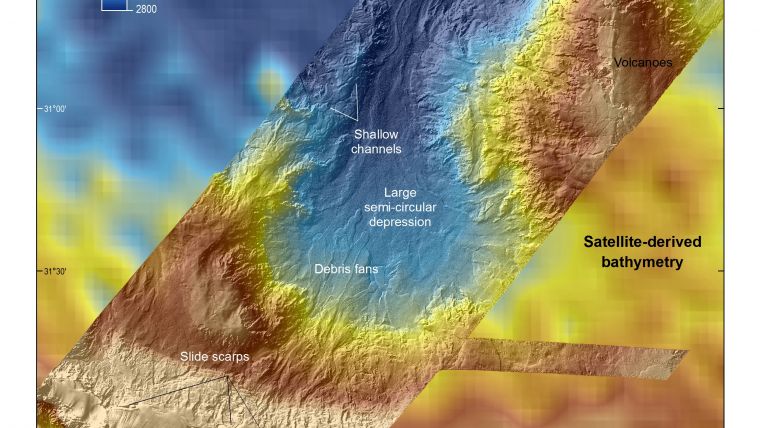
The igneous province subsequently experienced break up at ~43Ma and was eventually separated by seafloor spreading along the Southeast Indian Ridge (SEIR) (Figure 1). Broken Ridge north of its rifted southern flank generally has subtle relief due to the large amount of pelagic sediment overlaying the bedrock. In places, these sediments have been reworked downslope by slumps and debris flows (Figure 5). South of Broken Ridge other studies estimate that normal oceanic crust of the Australian-Antarctic Basin has formed along the SEIR at intermediate spreading rates of 59-75mm/yr. The shipborne MBES data swath traverses ~10 to ~35Ma old crust north of the SEIR, obliquely cutting across tectonic seafloor spreading fabric consisting of lineated abyssal ridges (≤200m of relief and ≥70km in length) and fracture zones (≤900m deep and ≤12km wide; Figure 6). As highlighted by other studies, these seafloor bathymetric details on the scale of abyssal hills are thus not expected to be resolved in satellite-derived bathymetry models, where they appear as an ‘orange peel’ texture, though this texture has some clues as to hill size and orientation.
Conclusion
The new multibeam data reveal the seafloor in unprecedented details and confirms that the satellite-derived bathymetry model is, for the most part, within its accuracy limits and useful for resolving broad-scale seafloor features. However, the difference between the two models highlights the necessity in pursuing high-resolution mapping to provide a better understanding of deep seafloor environments, including habitats and resources, and insights into the geological evolution and processes of this poorly known region of the world’s ocean. High-resolution mapping also enables the conduct of safe and effective deep-tow and AUV research in deep-water.
The transfer of raw data from the vessels ashore on a continuous basis also provides the shore-based management teams the ability to quality control, fault-find and issue revised tasking orders to optimise operations. The use of cloud-based technologies, even from offshore, has now become a reality. This project also shows that mapping transits adds greatly to the value of the product.
Detailed bathymetric information of the Earth’s seabed will indeed ‘empower the world to make policy decisions, use the ocean sustainably and undertake scientific research’ (Nippon Foundation – GEBCO seabed 2030 project).
Lesson learned for Seabed 2030 Project
The Nippon Foundation - GEBCO Seabed 2030 project aims to ultimately leave ‘no features of the world ocean floor larger than 100 metres unmapped’. This will be a considerable challenge, especially in regions such as the MH370 search areas and southern oceans, where the least amount of high-resolution data is available. As seen in the difference map between the MBES and the SRTM15 plus bathymetry models, over 60% is within 100m vertical accuracy level. Therefore, in the vertical accuracy, satellite-derived data can statistically meet the challenge. However, the horizontal resolution is more problematic. The MH370 search data show that for < ~6000m water depths, the present shipborne multibeam can meet the requirement for 100m resolution (Table 1). However, to realise such resolution in deeper areas, underwater vehicles will be required or expected resolution will have to be reduced. The mapping of the MH370 search and transit areas (1% of the Indian Ocean) took over 2 years with the effort of one ship, and after accounting for bad weather days. Therefore, if we consider mapping the entire Indian Ocean using the same pace and technology it would take in the order of 200 years to map, which is in accordance with Seabed 2030 estimates. Collective effort is obviously the key to success here.
Acknowledgements
Importantly, we acknowledge that the data was collected for the sole purpose of locating the missing plane, and we pay our respects to everyone touched by this tragedy. The governments of Malaysia, Australia and the Peoples Republic of China agreed to undertake the underwater search for MH370 in May 2014. The Australian Transport Safety Bureau led the underwater search on behalf of the Australian Government. We thank the masters and crews of the many ships that acquired the data. Thanks to the project team at Geoscience Australia for management of the project, data processing and delivery, and figure drafting. The views expressed here are solely those of the authors and do not constitute a statement of policy, decision, or position on behalf of NOAA. Published with the permission of the CEO, Geoscience Australia.
Further reading
- Becker, J.J., Sandwell, D.T., Smith, W.H.F., Braud, J., Binder, B., Depner, J., Fabre, D., Factor, J., Ingalls, S., Kim, S.H., Ladner, R., Marks, K., Nelson, S., Pharaoh, A., Trimmer, R., Von Rosenberg, J., Wallace, G., Weatherall, P., 2009. Global Bathymetry and Elevation Data at 30 Arc Seconds Resolution: SRTM30_PLUS. Marine Geodesy 32, 355-371.
- Coffin, M.F., Pringle, M.S., Duncan, R.A., Gladczenko, T.P., Storey, M., Müller, R.D., Gahagan, L.A., 2002. Kerguelen Hotspot Magma Output since 130 Ma. Journal of Petrology 43, 1121-1137.
- Goff, J.A., W.H.F. Smith, and K.M. Marks. 2004. The contributions of abyssal hill morphology and noise to altimetric gravity fabric. Oceanography 17(1):24–37.
- Lamarche, G., Lurton, X., 2017. Recommendations for improved and coherent acquisition and processing of backscatter data from seafloor-mapping sonars. Marine Geophysical Research.
- Smith, W.H.F., Sandwell, D.T., 1997. Global Sea Floor Topography from Satellite Altimetry and Ship Depth Soundings. Science 277, 1956-1962.
Websites
- http://marine.projects.ga.gov.au/mh370-phase-one-data-release.html
- https://eos.org/project-updates/geological-insights-from-malaysia-airlines-flight-mh370-search
- https://eos.org/opinions/airline-flight-paths-over-the-unmapped-ocean
- http://onlinelibrary.wiley.com/doi/10.1002/2014EO210001/full
- https://seabed2030.gebco.net/
A video released by Geoscience Australia in 2015 explaining Geoscience Australia’s role in the search for MH370, and the process in which the data is collected.

Value staying current with hydrography?
Stay on the map with our expertly curated newsletters.
We provide educational insights, industry updates, and inspiring stories from the world of hydrography to help you learn, grow, and navigate your field with confidence. Don't miss out - subscribe today and ensure you're always informed, educated, and inspired by the latest in hydrographic technology and research.
Choose your newsletter(s)


