International Bathymetric Charts
Since the 1970s, the International Bathymetric Charts (IBCs) of the Intergovernmental Oceanographic Commission have offered a framework for compiling soundings with a view to producing detailed maps of sea floor relief. Conceived in an era when marine cartography was still largely a manual and labour-intensive process, IBCs are evolving now to reflect advances in the technology for visualising and manipulating bathymetric information in digital form.
In 1974, the Intergovernmental Oceanographic Commission (IOC) launched a programme for the development of charts that would assemble existing soundings for the purpose of portraying seabed relief near the world's coastlines and over adjacent continental shelves. This initiative was motivated by the recognition that accurate and detailed descriptions of depth and morphology were essential to the advancement of marine science in these regions.
In recognition of the broad benefits to be gained from such charts, their production was proposed as a multinational undertaking, with the products to be known as International Bathymetric Charts (IBCs) and to be published under the auspices of the United Nations Educational, Scientific and Cultural Organization (UNESCO).
A key issue among the research concerns of the day was the influence of bottom topography on the movement of oceanic water masses, which scientists were beginning to model with tools that incorporated boundary conditions in the form of digital bathymetric grids describing seabed relief in a highly generalised fashion. This activity continues today, but the modelling tools at the disposal of the modern researcher are much more sophisticated, and the requirements for detailed boundary conditions "as derived from refined descriptions of seabed relief' are correspondingly more stringent.
In a more practical vein, the Boxing Day Tsunami of 2004 has cast modelling in new and much more urgent roles: to forecast the propagation of tsunamis to near and distant shores, and to predict the likelihood of catastrophic flooding along vulnerable coastlines. The reliability of these modelling analyses, however, is severely restricted in localities where near-shore and coastal bathymetry remain poorly known.
Early (Analogue) History of the IBCs
The first IBC series consisted of the ten sheets of the International Bathymetric Chart of the Mediterranean (IBCM) at a scale of 1:1,000,000. Printed in 1981 by the Head Department of Navigation and Oceanography of the Soviet Union, these full-colour charts featured hand-drawn depth contours. Geological and geophysical overlays followed over the next two decades.
As the first in the series, the IBCM provided a platform for the development of techniques and specifications that would be employed in subsequent productions. Reflecting the state of cartographic technology at that time, heavy reliance was placed on manual compilation and construction methods, with projects divided into manageable portions that were assigned to separate production teams in order to spread the workload. The process began with plotting sheets that covered the Mediterranean and Black Seas at a scale of 1:250,000, and provided a base for compiling point soundings. These were subsequently contoured and consolidated on 1:1,000,000 sheets for publication.
Following the IBCM model, the IOC initiated IBC projects for the production of bathymetric contour maps in five different regions: the Caribbean Sea and the Gulf of Mexico (IBCCA); the Central Eastern Atlantic Ocean (IBCEA); the Western Indian Ocean (IBCWIO); the Western Pacific Ocean (IBCWP); and the South East Pacific Ocean (IBCSEP). The responsibility for developing each IBC was assigned to an Editorial Board – essentially a team of technical specialists who had frequent exchanges to discuss problems and to co-ordinate activities.
Each series of IBCs comprises an agglomeration of 1:1,000,000 edge-matched sheets. It will be noted that not all sheets in all series have been completed.
While the early IBCs relied primarily on manual techniques, later products featured an increasing use of digital technology as the discipline progressed.
Challenges in Project Management
Some of the early IBC series demonstrated the feasibility of the IBCM model, whereas others posed significant project management challenges. With an overall scheme consisting of six separate project areas that encompassed about 175 separate 1:1,000,000 sheets, participants were faced with the necessity of assembling, absorbing and manipulating information pertaining to many sheet areas, and of managing the overall process so that seamless outputs were generated on time and according to specifications. This approach had several disadvantages:
- It was often difficult to monitor progress over so many fronts in order to identify problems and to resolve them in a timely fashion.
- Project areas were divided arbitrarily, promoting the fragmentation of data sets that should have otherwise remained intact and a form of "tunnel vision" within some project subgroups.
- There was a significant cost in production and communication overhead, given the necessity of matching the contents of adjoining sheets, and of sharing information among numerous project teams.
- There was a strong potential for duplication of effort when work was pursued independently in overlapping areas.
- There were prospects of incompatible products arising from the use of different data sets.
Transition to Digital Methods
In 1997, a new approach to constructing IBCs was adopted with the launch of the International Bathymetric Chart of the Arctic Ocean (IBCAO), which set out to produce a seamless description of seabed relief north of 64°N. Unlike previous IBCs, the IBCAO was developed in a totally digital fashion, without any of the cartographic constraints imposed by the scale and fragmentation of intermediate plotting sheets, or by the projection of the final published product.
Further differentiating it from previous IBCs, the primary output of the IBCAO was not a contour map, but a digital grid of depth values that could be manipulated effectively in a variety of visualisation and computational processes. A 1:6,000,000 map produced from this grid portrayed the sea floor in shaded relief form, as opposed to the linear isobaths of earlier maps; this representation was quickly accepted by the polar research community as a standard representation of the Arctic seabed. This approach had several advantages:
-A single project area resulted in a simpler, leaner management structure, with less production and communication overhead allowing the project team to maintain a view of the "big picture".
- The project area was naturally and geographically integrated, so major features could be defined coherently without concern for intervening sheet limits or fragmented data sets.
- There was no scope for duplication of effort between overlapping project areas.
- A single database facilitated the rationalisation and adjustment of observations, along with the application of uniform specifications throughout the project area.
Following the success of the IBCAO, the IBC of the Southern Ocean (IBCSO) was initiated along similar lines in 2006 with a view to portraying ocean depths south of 60°S. In the same year, the IBC of the North Atlantic (IBCNA) was launched to produce a description of ocean depths from the equator to the Arctic Circle. The IBCNA still awaits formal IOC approval, but the assembly and rationalisation of soundings from the map area have begun in earnest.
There has also been a suggestion for the development of the IBC of the South Atlantic (IBCSA) for describing bathymetry from the equator to the Antarctic Circle, but that proposition has yet to be acted upon.
Proposed Restructuring of the IBC Scheme
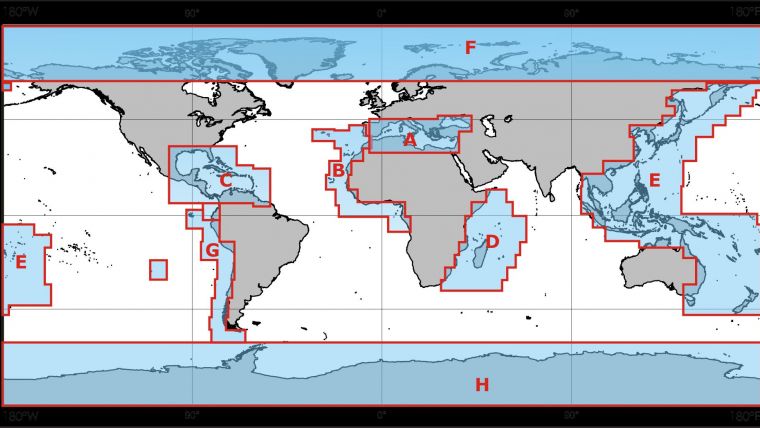
The practicality of the IBCAO, IBCSO and IBCNA has spawned proposals for a reorganisation and simplification of the IBC project structure so that it encompasses the entire world ocean in just eight project areas, each corresponding to a region defined by a major ocean and its marginal seas. The proposed project layout is shown in Figure 4. If this proposal were accepted, the existing IBC series could be easily integrated into the new, all-digital project structure.
Consultative Group for Ocean Mapping
The Consultative Group for Ocean Mapping (CGOM) provides project oversight for IBC activities. Its membership includes institutional repreÂsentation from its parent body IOC, from the International Hydrographic Organization (IHO) and from the IHO Data Center for Digital Bathymetry (DCDB). The remainder of the membership consists of IBC project leaders acting in their technical capacities. CGOM meets at regular intervals to review progress in the various IBC initiatives and to exchange information concerning the development of map products.
Conclusion
By dividing the world ocean into eight clearly defined project areas, the proposed restructuring of the IBC series will provide an effective global framework for systematic bathymetric compilations. With the operational responsibility for each area assigned to an appointed Editorial Board that features strong regional representation, it is to be expected that team members will be familiar with existing data sets within their compilation area and that they will have access to that information for inclusion in a regional inventory of depth observations.
Moreover, team members should be in a position to maintain an awareness of current and upcoming survey missions within their project area, and to negotiate access to the resulting soundings in order to fill gaps in the regional database. They should also be qualified to advise surveyors on optimum survey patterns for upgrading the state of bathymetric knowledge in the significant portions of the world ocean that remain woefully under-mapped. Such exchanges could usher in a new era of co-operation between the collectors and compilers of bathymetric information, and hasten the day when the global ocean floor has been thoroughly mapped.
|
Series |
Location |
Year begun |
Constituent Sheets |
Project Website |
||
|
Total |
In prep |
Done |
||||
|
IBCM |
Mediterranean and Black Seas |
1974 |
10 |
– |
10 |
www.ngdc.noaa.gov/mgg/ibcm/ibcm.html |
|
IBCEA |
Central Eastern Atlantic Ocean |
|
12 |
4 |
8 |
www.ngdc.noaa.gov/mgg/ibcea/start_e.htm |
|
IBCCA |
Caribbean Sea & Gulf of Mexico |
|
17 |
– |
17 |
www.ngdc.noaa.gov/mgg/ibcca/ibcca.html |
|
IBCWIO |
Western Indian Ocean |
1982 |
21 |
2 |
5 |
www.ngdc.noaa.gov/mgg/ibcwio/ibcwio.html |
|
IBCWP |
Western Pacific Ocean |
|
102 |
25 |
– |
|
|
IBCAO |
Arctic Ocean |
1997 |
1 |
– |
1 |
www.ngdc.noaa.gov/mgg/bathymetry/arctic/arctic.html |
|
IBCSEP |
South East Pacific Ocean |
2001 |
12 |
4 |
2 |
www.inocar.mil.ec/IBCSEP/english/index.html |
|
IBCSO |
Southern Ocean |
2006 |
1 |
1 |
– |
www.ibcso.org |
|
IBCNA |
North Atlantic Ocean |
2006 |
1 |
1 |
– |
www.geo.su.se/geology/ibcna |
Table 1. For each of the current International Bathymetric Chart (IBC) series, this table lists: the oceanic region that is encompassed by the IBC; the year in which it was launched; the number of its constituent sheets and their status (in preparation or complete); and a project website where detailed technical and administrative information may be obtained, such as data sources, construction procedures, names of participating agencies, members of project teams, ordering information, etc.

Value staying current with hydrography?
Stay on the map with our expertly curated newsletters.
We provide educational insights, industry updates, and inspiring stories from the world of hydrography to help you learn, grow, and navigate your field with confidence. Don't miss out - subscribe today and ensure you're always informed, educated, and inspired by the latest in hydrographic technology and research.
Choose your newsletter(s)


