It’s on the Map – But Does it Exist?
In a reversal of the centuries-old tradition of explorers undertaking ocean voyages of discovery with the hope of finding new land, a scientific party from the University of Sydney, Australia, has done the complete opposite. They have solved a mystery regarding the existence of a supposed island in the Southwest Pacific. The Australian Hydrographic Service has added a further explanation of the phenomenon.
The detective work took place on the RV Southern Surveyor, Australia's Marine National Facility research vessel, during a research voyage aimed at understanding the tectonic evolution of the eastern Coral Sea.
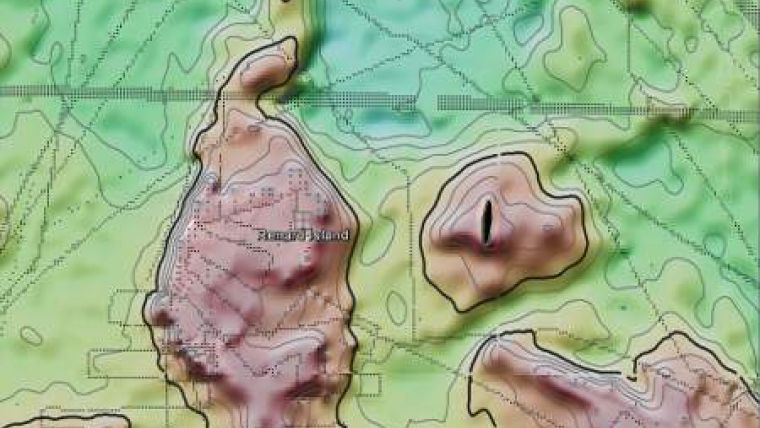
Chief scientist Dr Maria Seton from the School of Geosciences at the University of Sydney said the team became suspicious when the navigation charts used by the ship showed a depth of 1,400 metres in an area where scientific maps and Google Earth (image) showed the existence of a large island.
The maps that the scientists were using are based on a combination of the CIA World Data Bank and the World Vector Shoreline Database. Even Google Earth shows a black blob in the area of the mythical island. The rogue island has regularly appeared in scientific publications since at least the year 2000.
The team found that the navigational charts were accurate and there was no island in the area, so global maps including Google Earth need to be corrected. Dr Steven Micklethwaite from the University of Western Australia said to have started compiling information about the seafloor, which will be sent to the relevant authorities so that we can change the world map.
As well as mythbusting the existence of islands, the team have been collecting submarine data and rock samples from a little-explored part of the eastern Coral Sea. After 25 days at sea, they have collected 197 different rock samples, collected over 6,800 kilometres of marine geophysical data and mapped over 14,000 square kilometres of the ocean floor.
They uncovered rocks which were formed around 100 million years ago as Australia, Antarctica and New Zealand broke apart, as well as extensive limestone samples at 3,000 metres below the waves, revealing a massive drowning of the region over time.
Vulcanic Pumice
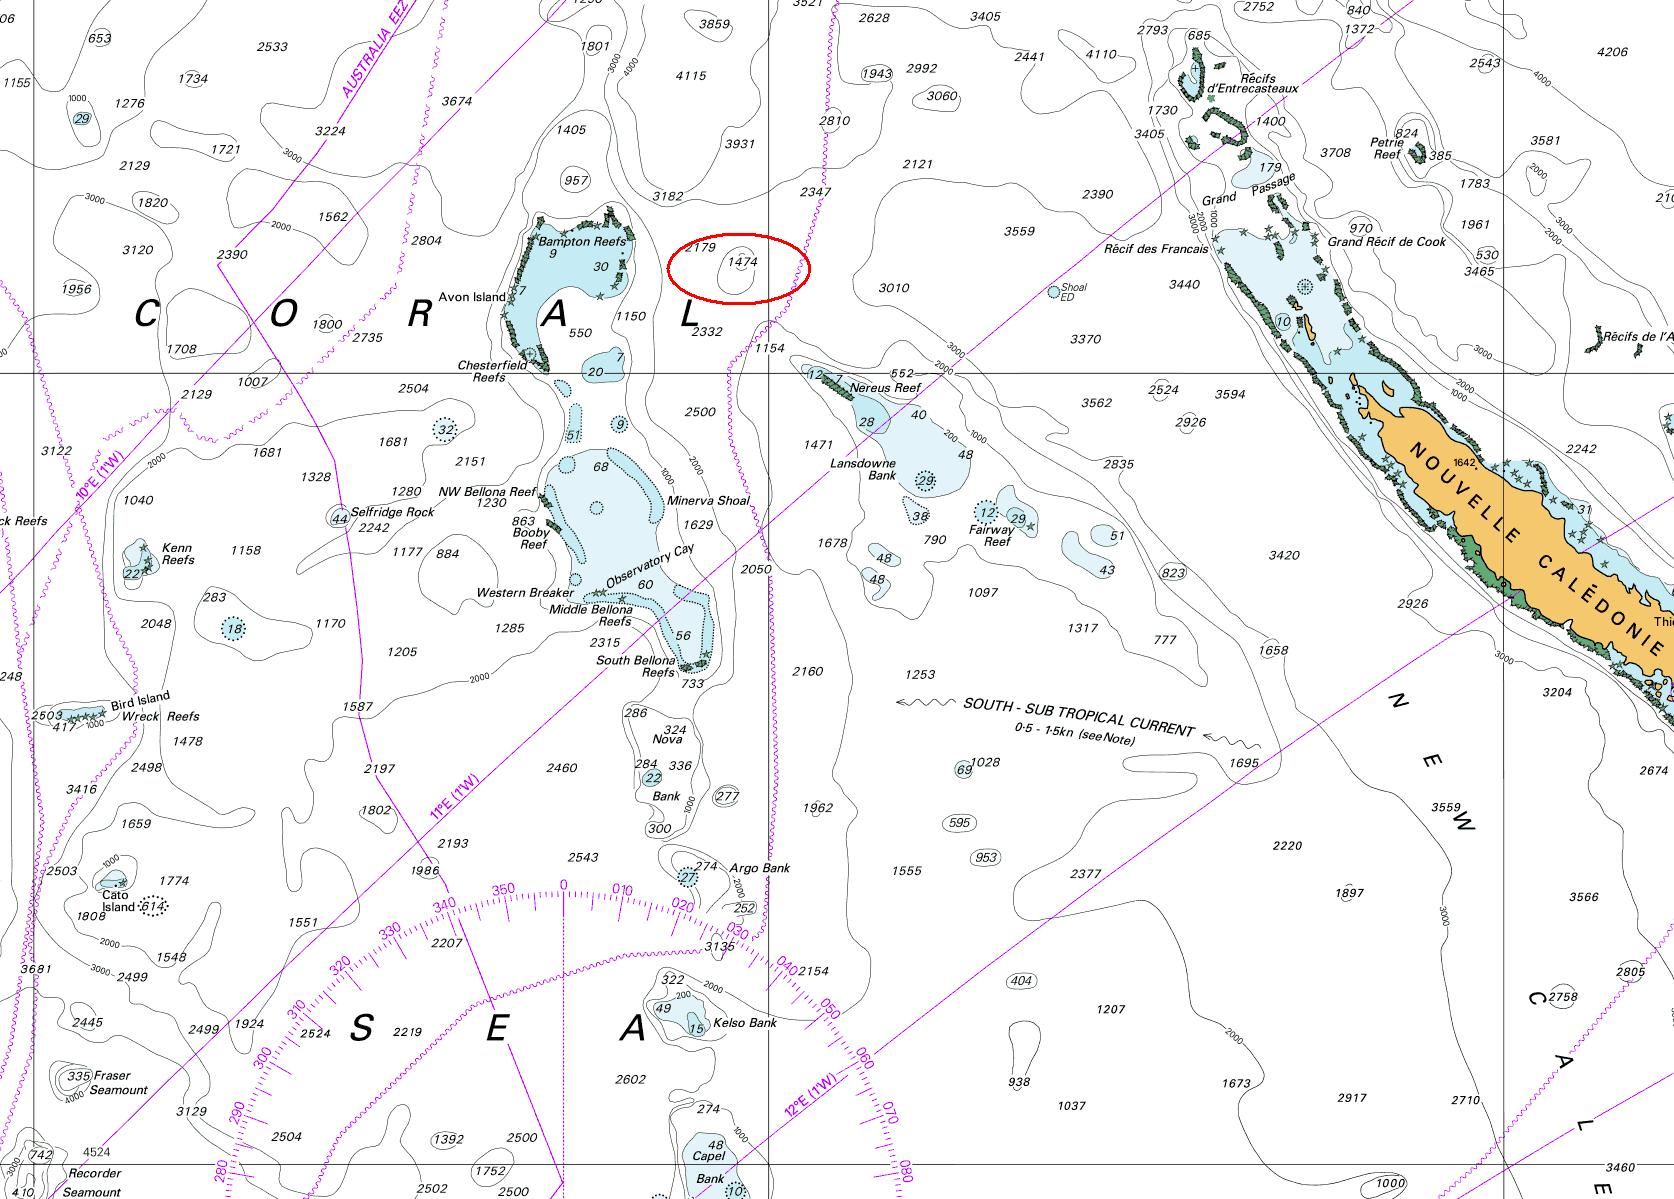
| AHS Chart of the Region AUS04602. |
The AHS has an explanation for the rather old phenomenon. The ‘phantom’ island was reported to the officers of HMS Barracouta as an unconfirmed sighting of ‘a line of sandy islands’ by the Master of the whaling ship Velocity in 1876. It was shown on charts with the legend ‘reported 1876’ beside the feature, the inference being that it may not exist. The report included an approximate extent for the line but no shape or size of individual features, though by 1888 it was charted as a single unconfirmed shoal with a similar extent to the modern World Vector Shoreline and subsequent Google Maps version. The reported position is also likely to have been highly approximate by modern standards as a result of the navigation systems in use at the time it was reported. As an example of a similar feature, the current edition of INT602 produced by the Australian Hydrographic Service (AHS) shows another doubtful shoal further east with ‘ED’ beside it – by modern international convention this stands for ‘existence doubtful’ (see bigger version of the chart at the left, right of the red circle).
The phantom island recently ’undiscovered’ was removed from the Australian produced International charts on 22 March 1985 following a deliberate and controlled search by the AHS. This search specifically proved it did not exist, along with other similar features elsewhere in the region, and was undertaken as part of a larger survey elsewhere in the South Pacific. This information was promulgated to both mariners and all other national hydrographic organisations reproducing INT 602 via Notice to Mariners 161 of 1985.
The 1985 survey found evidence of a submarine volcano at a depth of around 1,500 metres and noted areas of floating pumice. Based upon this, it is now strongly suspected it may have been an area of floating pumice which was sighted in 1876, though the extent of individual patches was probably much smaller than the Google Earth image infers, and would have been quite temporal, lasting no more than a few months at most. Cruising sailors have photographed similar features elsewhere in the South Pacific – the effect looks very convincing.
While it was removed from US charts several decades ago, the AHS is aware that the US National Geospatial Intelligence Agency (NGA) had reason as recently as two years ago to advise Google when they went live with their oceans dataset that the island as shown in their data was erroneous. The image on Google Earth has been clearly altered, by either accident or design, but bears none of the characteristics of any other reef, shoal or island that can be seen nearby. While many aspects of Google Earth are most impressive, by trying to provide a global view, they (and similar organisations providing global datasets) appear to have a limited capability to note conflicts between datasets that are only apparent at a detailed level. In this instance, even without relying on the advice from NGA, the mismatch between their ‘surface’ map showing the island and the ‘seabed’ imagery around it should have been sufficient to flag doubt and prompt a search of more authoritative and up to date sources
The AHS, in conjunction with GeoscienceAustralia, publishes the national gridded bathymetric dataset. The AHS holds original data or authorised copies of surveys upon which it is based. Data which has passed through the AHS has all been verified by qualified hydrographic surveyors, though not all data held by GA has had the same rigour applied. While the AHS has six survey ships and one aircraft collecting bathymetric data in support of charting, it also receives a vast amount of information from research cruises such as has sparked this recent media interest. These all undergo a quality assurance process before being added to the national hydrographic database, with a subset of this dataset being used for nautical charting. Dr Maria Seton, who headed the scientific cruise, will be rendering a copy of the data to the AHS in early 2013. Once the dataset has undergone an assessment process it will be added to the national hydrographic database and used to update affected nautical charts in the Coral Sea.


