Measuring and 3D mapping of sea ice in the Arctic
Beneath the tip of the iceberg
How can AUVs be reliably used to map the 3D structure of the underside of sea ice, especially now that the climate crisis makes it more important than ever to understand its complex structure?
Sea ice is one of the most important parameters when it comes to ice-albedo feedback, which is the fraction of incoming solar radiation that is reflected directly back into space. Because of the grave importance of the decrease in the amount of sea ice due to the climate crisis, gaining a full understanding of its complex structure is more important than ever.
Both large and small autonomous underwater vehicles (AUVs) have been used successfully to map the 3D structure of the underside of sea ice, but always in an experimental context. The challenge is to determine the best way forward to improve the quantity and quality of data gathering, and to turn the under-ice AUV into a reliable vehicle for routine use. This, as well as a wish to understand the full scope of sea-ice variability and not just the ‘tip of the iceberg’, is what is driving the authors of this article forward in their research and through trial and error. Their goal is to share their experiences, difficulties and suggestions for future solutions.
Historic overview
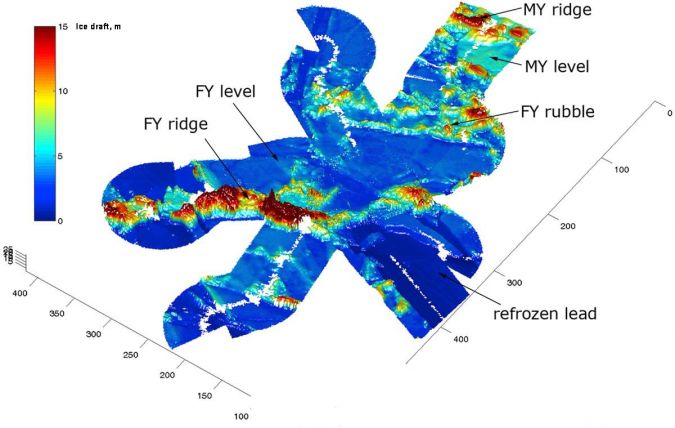
Mapping sea ice has been done by drilling samples since Fridjof Nansen’s ‘Fram’ expedition in 1893-1896. However, such drilled samples give a very limited view of the variability of sea ice. They are statistically weak and exclude the option to consider the shape of the underside of the sea ice, the distribution of pressure ridge depths, or the difference between the roughness levels of ridged and level ice, or between first-year and multi-year ice. All of these aspects are important to understand the multifaceted concept of sea ice and its effect on the surrounding climate.
Before the invention of the AUV, the ice mapping field was driven by military submarines and the upward sonar with which they were equipped, and this set the basis for the understanding of sea-ice thickness distributions. First came single-beam upward sonar, yielding a linear profile. Then came the side-scan sonar, with a fan-shaped beam in which the backscattered signal strength from each pulse is plotted against time, being interpreted as slant range. This constructs a map as the vessel proceeds along its track, with strong reflectors showing echoes and shadow zones. The ultimate solution, however, is the multibeam sonar, which gives a proper 3D picture of a swath of ice underside. The first use of upward-looking multibeam sonar from a submarine was by Wadhams in 2007 from HMS Tireless (Wadhams, 2008) using a Kongsberg EM2000 system.
A new development within this field is the stand-alone Ultra-Short BaseLine (USBL) positioning buoy, a method of underwater acoustic positioning which enables the more rapid and secure insertion, tracking and retrieval of AUVs, as well as in-mission low bandwidth communication. It consists of a USBL transducer with an integrated Attitude and Heading Reference System (AHRS) – a compact unit that provides 3D positioning of the AUV with high accuracy. Above-water, it has a Global Navigation Satellite System receiver (GNSS), which also includes a compass and a long-range Wi-Fi data radio to ensure contact with the mother vessel. This is mounted on a spar buoy together with batteries and interfacing equipment. The concept was first tested during a cruise with USCGS Healy in 2014 in the Beaufort Sea, north of Alaska, and further developed with stand-alone functionality for a cruise with M/V Polarsyssel in the Barents Sea in April 2017.
The 3D sea-ice mapping concept (of the future)
Based on experience from sea-ice mapping operations since 2002, the following list of requirements and recommendations has been created, in order to enhance the operational capabilities of an AUV system in ice-infested waters. The reason for suggesting these changes in the conduct of AUV operations under ice is to improve both the amount of data gathered and the quality of such data.
Risk analysis and mission planning
In order to provide an easy overview of all operational units; that is, the vessel, the USBL positioning buoys, the AUVs and the UAVs, their online position should be plotted on one screen, where the operations scenario can be transmitted to several stations aboard the vessel. In this way, the AUV supervisor is not doing the operational planning alone, as was the case in 2014 and 2017 from a laptop PC in a small boat. It now becomes a joint decision, where all operational conditions such as ice, icebergs, current, tides and weather are considered together, prior to the start of an AUV mission. The lack of this type of communication was a major contributor to the lack of reliable results in 2014 and 2017.

In the 2007 and 2008 expeditions, the AUV was deployed through a hole cut in the ice and was operated with a tether attached to the vehicle. This was needed both for insurance purposes and to ensure control in the event that the vehicle ignored its programmed instructions. In 2014 and 2017, the AUV was operated from a ship’s man overboard boat, again with a tether. The experience gained from these operations is that the tether reduces the operational capabilities of the AUV so much that it cannot even carry out a track consisting of a lawnmower pattern. During all the operations mentioned above, only smaller areas than desired and planned were covered, which again reduced the amount of reliable data.
These experiences created a foundation on which the idea for the USBL buoy was built, where the purpose is to remove the requirement for the tether. When it is no longer necessary to operate the AUV with a tether, it can be launched and recovered from the mother vessel, which eliminates the use of small boats, something which has a high-risk exposure in ice-infested Arctic waters. In general, it can be said that the tether is an insurance-required safety feature that extremely limits the scope and quality of the data gathering which is, after all, the main point of the AUV mission. The addition of the stand-alone USBL positioning buoy to the mission means that the positioning and communication of and with the AUV will be more reliable, the process of collecting data will in turn become smoother and the safety of the crew will be higher.
Deploying one or maybe even two of this type of buoy means that the position of the AUV under the ice is always tracked. This also reduces the risk of losing the AUV underneath the ice, as was the case during the expedition in 2012.
“Go there and loiter”
After the USBL positioning buoy has been deployed and the AUV has been launched from the mother vessel, the obvious survey plan is to programme the vehicle’s navigation to carry out a systematic survey of the ice area or ice features that are of interest. However, the question arises of how best to terminate the survey and recover the vehicle. When ending or aborting a mission, it seems obvious that the vehicle should be brought to the surface for recovery. But supposing the surface is ice-covered, or the survey lines leave the vehicle at a considerable distance from the ship – what then?
To deal with this problem, Krogh suggested the concept of “Go there and loiter”, in which a position is specified to which the vehicle goes and then circles around at a pre-determined depth until the operator decides upon surfacing or some new navigational instruction. This can also be the default option for an aborted mission. If this step is not considered, the recovery of the AUV can prove difficult due to the sea ice. Consider the situation where the AUV develops an error and the mission is aborted. In that situation, the AUV is normally ballasted slightly light, meaning that it will stop the engine and drift to the surface. If there were no sea ice, the vehicle would arrive at the surface and would be found by the mother vessel by its Wi-Fi link, the strobe light, or even a communication satellite such as an Iridium modem. However, these safety features cannot work under water and if the AUV drifts up under an ice floe it is almost impossible to reach. This is the worst place to find an AUV again if it is ‘dead’ under drifting sea ice.
Conclusion
This is an exciting time for the development of ice sensing using autonomous vehicles. The invention of smaller, more efficient and reliable designs of AUVs makes it easier and cheaper to deploy vehicles under ice, conduct surveys and obtain systematic results on ice mapping. At the same time, the very rapid development of UAV technology gives a low-cost tool which can supply equivalent data on the upper surface topography of the same ice. All that remains is the perfection of the technology that will allow these two systems to be joined together and used in the field to provide full 3D mapping of ice floes. This technology could also be used to research and understand other ice phenomena such as icebergs and pressure ridge distributions. The most important role of such surveys will be to help us understand and map the rapid decline in the ice extent and especially thickness, which result from the Arctic amplification of global warming.

Value staying current with hydrography?
Stay on the map with our expertly curated newsletters.
We provide educational insights, industry updates, and inspiring stories from the world of hydrography to help you learn, grow, and navigate your field with confidence. Don't miss out - subscribe today and ensure you're always informed, educated, and inspired by the latest in hydrographic technology and research.
Choose your newsletter(s)


