Pushing Lidar to the Limits
High-resolution Bathymetric Lidar from Slow-flying Aircraft
Airborne bathymetric Lidar is an ideal tool to study underwater features in the usually rather clear waters along the coast of Australia. Due to the remoteness of many of the continent’s coastlines, this is often the only economically viable option for large-scale bathymetric mapping at high resolution. A new toolkit consisting of two airborne Lidar systems flown on a small and slow-flying research motorglider was trialled in NW Western Australia. The same technology will be used over the next three years in the context of a comprehensive study of submerged archaeological landscapes of the so-called ’Sea Country’, more than 1,000km along the NW Western Australian coast.
By Prof Jorg M. Hacker, CEO and chief scientist of Airborne Research Australia, and Dr Martin Pfennigbauer, RIEGL
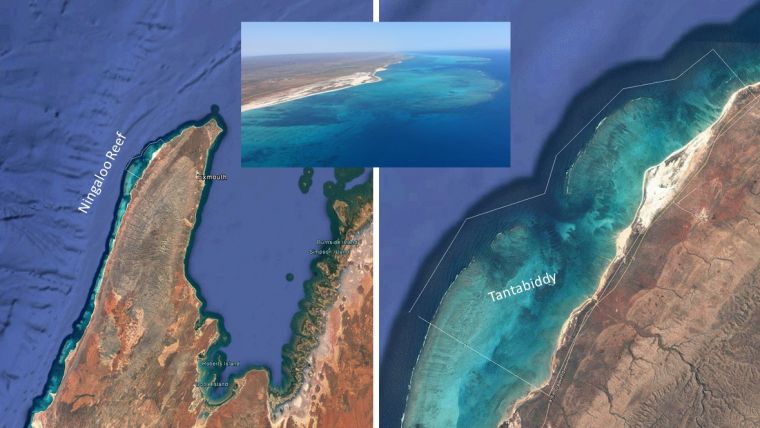
Everybody knows the Great Barrier Reef along the East coast of Australia, but there is also an amazing coral reef along the northwest coast of Australia – Ningaloo Reef (Figure 1). Ningaloo Reef waters are famous for their rich marine life, including whale sharks, a slow-moving filter-feeding shark and the largest known extant fish species. Like the Great Barrier Reef, much of Ningaloo is World Heritage protected.
The waters of Ningaloo Reef can be extremely clear with a water depth of between 0-15 metres within the reef lagoon. This makes bathymetric Lidar an ideal tool to study the reef’s underwater structure in great detail. One of the most interesting areas is the ocean edge, where the reef falls away from just below the water or even a few centimetres above the water into the deeper waters 30m below the coastal shelf just 1-2km from the coast. This is also where most of the larger fish and mammals such as whale sharks, marlins and manta rays can be observed.
Achieving Very High-resolution Lidar Bathymetry
In October 2016, Airborne Research Australia (a not-for-profit independent research institute) flew two RIEGL airborne small-footprint Lidars (VQ-820-G and LMS-Q680i-S) mounted on a slow-flying (manned) motorglider (Diamond Aircraft HK36TTC-ECO-Dimona) over the 50km2 Tantabiddy area of Ningaloo Reef. The aim was to achieve the highest possible spatial resolution of the bathymetry and – at the same time – gain a detailed image of the wave patterns at the water surface.
The LMS-Q680i-S was scanning downwards with a wavelength of 1,064nm (infrared) and the VQ-820-G Lidar had its 532nm beam swath (green) pointing 20° backwards. The infrared light reflects off the water surface and topography whereas the green light penetrates the water column and reflects off objects underwater (Figure 2). Data was captured along flight lines 250m apart, flying at 600m above the water. As the aircraft can also fly rather slowly (35-40m/s), rather high point densities of more than 30 points/m2 were achieved for combined data (after removing noise returns). Simultaneously with the Lidar, data aerial photographs were taken.
Multiple Overpasses with Different Scanner Settings
To maximise both the detail of the underwater reef structure and the water depth to which the Lidar was able to resolve the seafloor, two overpasses were flown along each flight line with different settings of the bathymetric Lidar, (i.e. pulse rates of 284kHz and 522kHz). The point clouds from both overpasses were combined to ensure best possible alignment by using Bayesian statistics in combination with the LAStools suite from rapidlasso.com. The bathymetric Lidar point cloud was interactively cleaned by inspecting cross sections using the GlobalMapper V17 software.
The double overpasses of each flight line not only offered the unique opportunity to confirm the very high resolution of the bathymetry showing identical details of the reef structure, but also yielded a more complete coverage around the reef edges where some white caps were present. In addition, comparisons with RGB imagery taken during the overpasses were used to further confirm the structural details of the reef bathymetry visually.
Data from the individual overpasses seem to indicate that the green Lidar set to a pulse rate of 284kHz achieves a somewhat better sounding depth – on average between about 20-30% – while it achieves a higher spatial resolution when set to 522kHz.
Results
Reef structure
Using the two Lidars enabled accurate mapping of the ocean surface and the underwater topography. Assisted by the near-ideal weather and water conditions at the time, it was possible to map the underwater structure in much greater detail than the data available from earlier surveys, and down to water depths of nearly 15m. As a side benefit, the unique airborne platform ensured minimal impact from the aircraft on the sensitive environment by means of its very low noise footprint and the use of unleaded petrol.
The processed 25cm pixel-size bathymetric data shows elongated ridges approximately perpendicular to the reef’s edge, typically between 1.5-3m high and 3-5m wide (Figure 3). These structures – sandbanks, rocky platforms and even individual rocks – are also clearly visible on the RGB aerial images (Figure 4). Comparisons with available high-resolution data, such as for instance taken from a jet-ski-mounted singlebeam echosounder (but not IMU corrected), along an array of survey lines showed a very similar structure and approximately +/-0.3 metres vertically on average (after alignment of the structures).
Fish behaviour – scope for further analysis
The removal of spurious returns during processing of the data, (i.e. the so-called ‘de-fishing process’), revealed a large number of fish, both individually and shoaling. To derive the reef structure, these data points were eliminated, but they may well enable study of shoaling behaviour itself, especially as there are two independent datasets available about one hour apart.
Wave patterns and wave speed
The point cloud derived from the infrared RIEGL LMS-Q680i-S Lidar enabled the ocean surface to be mapped in great detail in terms of wave structure which can be used to optimise the bathymetric measurements (Figure 5). As the overall wave pattern changed from one series of overpasses to the next (one hour apart), Figure 6 shows data from one series of overpasses only.
When combined with the green RIEGL VQ-820-G data which sees the ocean surface about two seconds later (due to the VQ-820-G Lidar’s scan swath pointing 20° backwards with the aircraft flying at about 40m/s at 600m altitude), it can even be used to derive an approximate wave train propagation speed from the corresponding peaks in the two images, assuming that the overall wave pattern has not changed within those two seconds (Figure 6).
Acknowledgements
The Lidars were operated by Ms Chakravarty. The navigation data was processed by Mr Lieff. The study is a collaboration with Prof Lowe and Dr Hansen (University of Western Australia). The Hackett Foundation contributed substantial funding to the study.
Further Reading
An animation of the results in terms of wave patterns and the underlying reef structure, as well as more results can be viewed on www.airborneresearch.org.au.
Biographies of the Authors
Prof Jorg M. Hacker is founder, director and chief scientist of Airborne Research Australia (ARA), Australia’s only non-commercial entity which uses aircraft for environmental research. He is also a professor at Flinders University. He pioneered the concept of using cost-efficient small aircraft for research and has amassed more than 7,000 flying hours, most of them during research missions. [email protected]
Dr Martin Pfennigbauer is product manager for hydrographic airborne laser scanning at RIEGL Laser Measurement Systems GmbH, Austria. [email protected]
Figure Captions
Figure 1: Ningaloo Reef and the Tantabiddy area. Inset: Aerial view of the Tantabiddy area during the flight.
Figure 2: Sketch of the arrangement of the two Lidars in the under-wing pods of the ARA research motorglider.
Figure 3: Bathymetry of the western edge of Ningaloo Reef, including the ~500m wide sandbanks within the reef. Spatial resolution is 25cm. Data is a combination of multiple overpasses using different scanner settings.
Figure 4: Reef features between 0.2 and 4m underwater seen by aerial RGB image (left) and Lidar bathymetry (right) – a sandbank and some rocky platforms. Inset: Vertical cross section through the rock and sandbank feature.
Figure 5: Ocean surface as mapped by the red Lidar at 50cm horizontal resolution.
Figure 6: Wave propagation speed derived from the combination of the green and red Lidar. Inset: Perpendicular cross section of the wave height (red = red Lidar, blue = green Lidar)

Value staying current with hydrography?
Stay on the map with our expertly curated newsletters.
We provide educational insights, industry updates, and inspiring stories from the world of hydrography to help you learn, grow, and navigate your field with confidence. Don't miss out - subscribe today and ensure you're always informed, educated, and inspired by the latest in hydrographic technology and research.
Choose your newsletter(s)


