Satellite-derived Bathymetry
A Reconaissance Tool for Hydrography
A study was conducted to evaluate the use of a satellite-derived bathymetry (SDB) procedure to map shallow-water bathymetry in a GIS environment, and to identify areas that require a new hydrographic survey. Publically available, multispectral satellite imagery and published algorithms are used to derive estimates of the bathymetry. The study results indicate a potential use of the procedure by national hydrographic offices as a reconnaissance tool.
In some developing countries, the information available to plan and prioritise hydrographic surveys is typically based on visual inspection of existing nautical charts. However, due to the age of many existing charts and lack of availability of the original source data from which they were compiled (e.g., smooth sheets) this type of analysis is often quite limited.
The ability to derive bathymetry from multispectral satellite imagery is a topic that has received considerable research attention since the 1970s. Typical multispectral satellite platforms (e.g., Landsat, Ikonos, SPOT, and WorldView) collect data in multiple spectral bands that capture a broad spectral range (40 to 150nm). Collectively, these bands typically span the visible to infrared portions of the electromagnetic spectrum. The physical concept underlying the ability to estimate bathymetry from multispectral imagery is the wavelength-dependent attenuation of light in the water column. To date, numerous algorithms for bathymetry retrieval have been developed. However, a detailed study has not been made on the ability to make use of these algorithms and procedures for operational survey planning in national hydrographic offices of developing countries.
Although the accuracy of SDB does not meet current International Hydrographic Organization (IHO) S-44 standards, results from this technique suggest that SDB can be a useful tool for survey planning and prioritisation, especially for national hydrographic offices with limited resources. However, this application has two main requirements: 1) the data must be referenced to a chart datum (typically a tidal datum), and 2) the procedures must be based on readily-available, low-cost data and software.
Landsat 7
Landsat 7 imagery is free and publically available (http://earthexplorer.usgs.gov/). An eight-band multispectral-scanning radiometer, the Enhanced Thematic Mapper plus (ETM+), collected imagery with 185km swath-width and an image resolution of up to 28.5m. The large swath of the Landsat imagery can potentially cover nautical charts of the scale of 1:50,000 to 1:60,000 with a single image. Although the Landsat ETM+ imagery has fairly coarse resolution, it is significantly smaller than the maximum allowable spacing between charted soundings of 300m (in ground distance) of the scale of charts used in the study. For the procedure, only three (blue, green, and near-infrared) of the eight bands are needed. The Landsat imagery is ortho-rectified and referenced to the WGS84 datum with a stated positional uncertainty of better than 50m. Although Landsat 7 images that are useful for SDB were only collected from April 1999 to June 2003, this time frame is more recent than survey data in many charts of developing countries. Many of these surveys were conducted more than 50 years ago.
Procedure Development
The satellite-derived bathymetry procedure was developed using a US calibration study site (Rockport, Massachusetts), which has a low-energy wave environment with a tidal range of about 2.5m. It is important to note that only a few, carefully-selected chart soundings are used in the procedure to reference the satellite-derived bathymetry to the chart datum. One of the main criteria for the selection of this small subset of reference soundings is that the soundings are located in areas of relatively stable seafloor that have likely not experienced significant change since they were charted. These soundings are used as control points to determine the transformation parameters used in the algorithm. Although the instantaneous water level at the time of satellite image acquisition is very unlikely to coincide with the chart datum (e.g., Mean Lower Low Water (MLLW) or Lowest Astronomical Tide (LAT)), there is no need to measure the tide height during the image acquisition. The control points reference the bathymetric model directly to the chart datum. Thus, the procedure eliminates both the need for tide-coordinated imagery and for tide correctors.
An Airborne Lidar Bathymetry (ALB) survey that was conducted in 2007 by the US Army Corps of Engineers was used as a reference dataset. The ALB reference dataset was transformed to the MLLW tidal datum using NOAA's VDatum software. ALB is considered an accurate survey technology that meets IHO Order 1b Total Vertical Uncertainty (TVU) specifications for soundings that are able to penetrate at least twice the water depth using SDB. Bathymetry from the satellite imagery was derived using a ratio of green-to-blue Landsat band pairs and was referenced using chart soundings (NOAA chart 13279). The high-resolution ALB reference dataset (4m) was gridded at the Landsat’s image resolution (28.5m) for purposes of comparison.
The study results from the US calibration site show that the effective depth of penetration where submersed features are inferred was between 5 and 6m. Although the average depth difference between the satellite-derived bathymetry results and the ALB reference dataset is small (0.30m), the standard deviation (1σ) of the depth difference is 1.79m. The results indicate that there is a correlation between the accuracy of the bathymetric model and the water clarity.
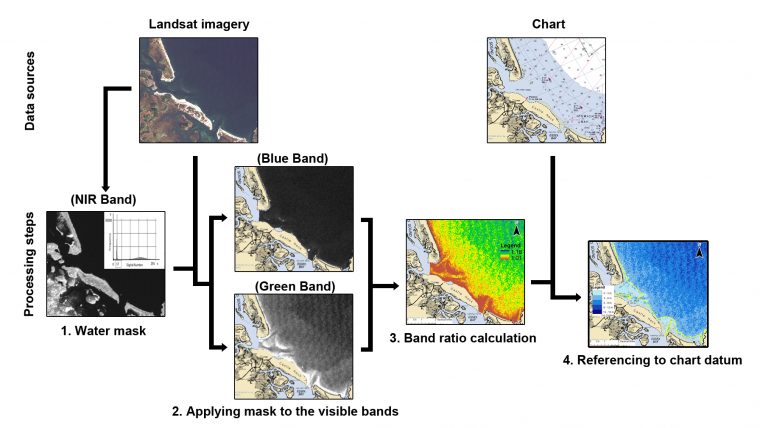
The procedures developed using the data from the calibration site involve four main steps (Figure 1): 1) Satellite imagery is downloaded based on the geographic extent and environmental conditions (e.g., cloud coverage and sun glint), where dry land and most of the clouds are removed (masked out) using the Near-Infrared band; 2) ‘Speckle noise’ in the Landsat imagery is removed from the blue-green band using spatial filtering; 3) A blue-green band ratio algorithm is applied to derive bathymetry; and 4) The optical depth limit for inferring bathymetry (also known as, the extinction depth) is calculated and the algorithm values are referenced to the to the chart datum using the chart soundings.
Evaluation of C-55 Sites
In addition to the US calibration study site, shallow-water bathymetry was also evaluated over the coastal waters of Nigeria and Belize. These sites were selected based on the IHO publication C-55, which identified nautical charts that contain gaps in their hydrographic data. In Nigeria, the satellite-derived bathymetry correlated well with areas that have been recently surveyed (a commercial survey from 2004) near the entrance to Escravos River. Bathymetry derived from the procedure identified significant differences between depths and chart soundings in the northern section of the chart over a large area (several tens of square kilometers) and in the Benin River mouth north to Escravos River. In order to simplify the comparison, the depth ranges were segmented based on significant navigational depths: from 0m to 5m, 5m to 30m, 30m to 40m and greater than 40m. Based on the source diagram and the chart symbols, a probable cause of this difference is that the area has not been surveyed since 1913 (Figure 2). A notable outcome of the study in the Belize study site was that the location of a natural channel between Belize City and Big Creek observed using SDB is east of its location in the current nautical charts (Figure 3).
Future Directions
Based on the results of this study and responses from several hydrographic groups, this initiative is currently being expanded in collaboration with the General Bathymetric Chart of the Oceans (GEBCO) group and Integrated Ocean and Coastal Mapping (IOCM) programme in National Oceanic and Atmospheric Administration (NOAA). The procedure was documented and published in the GEBCO Cookbook. Since mid-2013, imagery from the new Landsat satellite (Landsat 8) is free and publically available and can also be used to derive bathymetry.
Acknowledgements
The authors would like to thank Dr Lee Alexander and Captain Andrew Armstrong (NOAA, ret.) for their advice. In addition, we want to thank NOAA and the UKHO for the copyright permission to use their charts for this study.
More Information
General Bathymetric Chart of the Oceans (GEBCO), 2012. GEBCO Cook Book V2.6.13: http://ibis.grdl.noaa.gov/SAT/GEBCO_Cookbook/index.php.
International Hydrographic Organization (IHO). 2004. Publication C-55, Status of Hydrographic Surveying and Nautical Charting Worldwide, Monaco, third edition (Latest Update 27 September 2011).

Value staying current with hydrography?
Stay on the map with our expertly curated newsletters.
We provide educational insights, industry updates, and inspiring stories from the world of hydrography to help you learn, grow, and navigate your field with confidence. Don't miss out - subscribe today and ensure you're always informed, educated, and inspired by the latest in hydrographic technology and research.
Choose your newsletter(s)


