Sea Levels and the Coast
The oceans are a central part of the global climate system. As Roger Revelle, one of the early directors of the Scripps Institute of Oceanography, said, “The oceans exert a profound influence on mankind and indeed upon all forms of life on Earth. The oceans are inexhaustible sources of water and heat, and control the climate of many parts of the world.” He also recognised that “human beings are now carrying out a large-scale geophysical experiment of a kind that could have not have happened in the past nor be reproduced in the future”.
Roger Revelle’s thoughts have even more importance today as we continue to alter the Earth’s atmosphere with far-reaching consequences for climate, conditions in the ocean and at the coast, and the habitability of our planet. What will the impact be of this experiment? What are the consequences? One of the consequences of climate change is rising sea levels.
The coastal zone has changed profoundly during the 20th century, primarily due to growing populations and increasing urbanisation. In excess of 150 million people live within one metre of high-tide level; 250 million within five metres of high tide. By 2010, twenty of thirty megacities will be on the coast, with many low-lying locations threatened by sea-level rise. With coastal development continuing at a rapid pace, society is becoming increasingly vulnerable to sea-level rise and variability – as Hurricane Katrina recently demonstrated in New Orleans. In the Bay of Bengal, there have been 23 surge events with over 10,000 people killed in each since 1737. The severe impact was most recently felt in 1970 (about 300,000 people killed) and 1991 (about 140,000 killed and ten million made homeless). In Europe the storm surge of 1953 had a major impact with the loss of over 2,100 lives in The Netherlands and the UK.
Rising sea levels are felt most acutely through the increased frequency and intensity of extreme storm surges and flooding. For example, a 100-year coastal flooding event could become a 10-year event at some locations before the end of the 21st century. Increases in the frequency of extreme sea levels of a given height have already been observed in a number of locations around the world, particularly in the Pacific Ocean and along the east coast of North America. Data from Australia’s east and west coasts indicate that high sea levels of a given value occurred about three times as often in the latter half of the 20th century compared with the first half. Many coastal megacities are built on deltaic regions where significant sinking is occurring, making them particularly vulnerable to these extreme events. Unless such change is taken into account, design criteria for existing coastal structures can become out-of-date and lead to catastrophic flooding such as experienced in New Orleans with Hurricane Katrina. Moreover, the possibility that severe weather events may become more frequent and/or intense with our changing climate will only make matters worse.
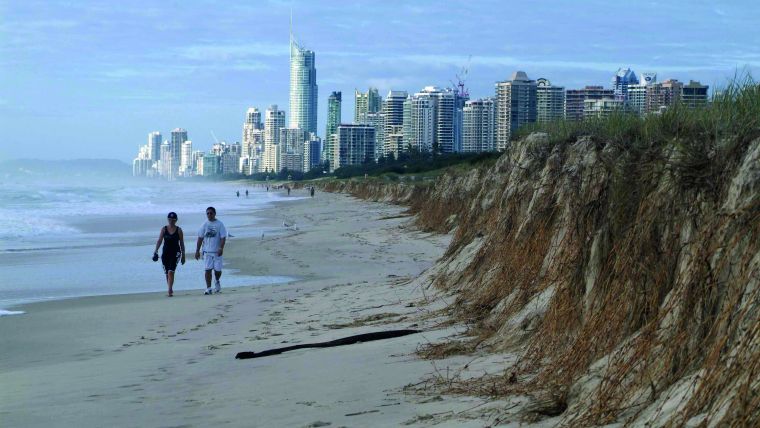
Rising sea levels will also contribute to the erosion of the world’s sandy beaches, 70% of which have been retreating over the past century. Sandy-beach erosion commonly occurs at tens to hundreds of times the rate of sea-level rise and will degrade or remove protective coastal features such as sand dunes and vegetation, further increasing the risk of coastal flooding. Low-lying islands are also vulnerable to sea-level rise.
An improved understanding of sea-level rise and variability will help reduce the uncertainties associated with projections of sea-level rise, thus contributing to more effective coastal planning and management. Adaptation measures, including enhanced building codes, restrictions on where to build, and developing infrastructures better able to cope with flooding, should help to minimise the potential losses. The above issues touch on many sectors of the hydrographic and dredging industry, i.e. enhanced provision of sea-level observations and derived products, monitoring of datums for topography and bathymetry, supporting safe navigation of harbour activities, coastal engineering and flood defence construction/maintenance.
Has Sea Level Changed in the Past
Sea level has varied by over 120m during glacial–interglacial cycles as the major ice sheets have waxed and waned. Sea level was about 4–6m above present-day values during the last interglacial period, when Greenland was about 3°C warmer than today. Melt water from the Greenland Ice Sheet was probably the largest single contributor to this higher sea level. During the last ice age, sea level fell to more than 120m below present day levels as water was stored in the northern hemisphere and the Antarctic Ice Sheets. As the ice melted, starting around 20,000 years ago, sea level rose rapidly at average rates of about 10mm/year (1m/century), and with peak rates in the order of 40 mm/year (4m/century), until about 7,000 years ago.
The Last Few Thousand Years
Over the last 7,000 years, sea level rose much more slowly, with a decreasing contribution in the last few thousand years. Sea-level data inferred from the location of ancient Roman fish tanks dated about 2,000 years before present indicate that there has been little net change in sea level from that time until the start of the 19th century. Changes in local sea level estimated from sediment cores collected in salt marshes have revealed an increase in the rate of sea-level rise in the western and eastern Atlantic Ocean during the late 19th century or early 20th century, consistent with the few long tide-gauge records from Europe and North America.
The Historical Record
Coastal and island tide-gauge data show that sea level has risen by just under 20cm between 1870 and 2001, at an average rate of 1.7mm/year during the 20th century and an increase in the rate of rise over this period, consistent with the geological data and the few long records of sea level from coastal tide gauges (Figure 2). From 1993 to the end of 2006, near-global measurements of sea level (between 65°N and 65°S) made by high-quality satellite altimeters (and estimates from coastal and island tide gauges) indicate that global average sea level has been rising at 3.1 ± 0.4mm/year. The uncertainty estimates of about 0.4mm/year relate primarily to satellite calibration and reference frame issues. The rate of sea-level rise over the last twenty years is 25% faster than any rate during the previous 115 years, almost twice as fast as the average over the 20th century, which was in turn an order of magnitude larger than the avarage rate of rise over the two millennia prior to the 18th century.
Why is Sea Level Rising?
The two major reasons for sea-level rise are expansion of ocean watersas they warm and an increase in the ocean mass, principally from land-based sources of ice (glaciers and ice caps, and the ice sheets of Greenland and Antarctica). Global warming from increasing greenhouse gas concentrations is a significant driver of both contributions.
From 1955 to 1995, ocean thermal expansion was estimated to have contributed less than 25% of the observed rise. However, for 1993 to 2003, when the best data are available, thermal expansion was estimated to be significantly larger at about 50% of the observed sea-level rise of 3.1mm/year. However, ongoing analyses have revealed significant instrumental bias, which will lead to revised estimates of ocean thermal expansion. The melting of glaciers and ice caps (excluding the glaciers surrounding Greenland and Antarctica) contributed about 25% of the observed rise for both the 1961–1990 period and the satellite altimeter period since 1993.
The ice sheets of Antarctica and Greenland have the potential to make the largest contribution to future sea-level rise, but they are also the greatest source of uncertainty. Since 1990, there has been increased accumulation at high elevation on the Greenland Ice Sheet, while at lower elevation there has been more widespread surface melting and a significant increase in the flow of outlet glaciers. The net result is a decrease in the mass of the Greenland Ice Sheet – a positive contribution to sea-level rise. For the Antarctic Ice Sheet, there is greater uncertainty. Over recent years, increased glacier flow on the Antarctic Peninsula and the West Antarctic Ice Sheet are thought to dominate over increased thickening of the East Antarctic Ice Sheet. There are insufficient data to make direct estimates over the preceding decades but modelling studies suggest that the Antarctic Ice Sheet is still responding to changes since the last ice age and contributing to sea-level rise.
The contributions do not sum to the observed sea-level rise. One possible reason for this discrepancy is the inadequate ocean database, particularly for the deep and southern hemisphere oceans, leading to an underestimate of ocean thermal expansion. Of course, there is also an inadequate database for assessing historical changes in the cryosphere. Changes in the terrestrial storage of water (changes in lakes, building of large and small dams, seepage into aquifers and mining of ground water) may also be important, but the sum of these contributions in poorly known.
Future Sea-level Change
During the 21st century, sea level will continue to rise due to warming from both past and 21st century greenhouse gas emissions. Ocean thermal expansion is likely to be the dominant contribution to 21st century sea-level rise, with the next largest contribution coming from the melting of glaciers and ice caps.
Recent estimates indicate that non-polar glaciers and ice caps may contain enough water to raise sea level by 15–37cm. As they melt in a warming climate, the glaciers at lower altitude and latitude reduce in size significantly, reducing their contribution to the rate of sea-level rise.
For Greenland, both glacier calving and surface melting contribute to mass loss. Over the last few decades, surface melting has increased and is expected to dominate over increased snowfall leading to a positive contribution to sea level during the 21st century. For the majority of Antarctica, present surface temperatures, and those projected for the 21st century, are too cold for significant melting to occur and Antarctic precipitation is balanced by glacier flow into the ocean. For the 21st century, climate models project an increase in snowfall, resulting in increased storage of ice in Antarctica, partially offsetting other contributions to sea-level rise. However, this increase in precipitation has not been observed to date.
In addition to these surface processes, there are indications of a potential dynamic response of the Greenland and Antarctic Ice Sheets. In Greenland, there was a significant increase in the flow rate of many of the outlet glaciers during the last decade. One potential reason is increasing surface melt water making its way to the base of the glaciers, lubricating their flow over the bedrock, consistent with increased glacier flow during the summer melt season.
Another potential factor is the role of ice shelves in restraining the flow of outlet glaciers. The rapid break up of the Larsen B ice shelf in the Antarctic Peninsula was followed by a significant increase in the flow rate of the glaciers previously feeding this ice shelf. Also, the West Antarctic Ice Sheet is grounded below current-day sea level. As the ice sheet thins and starts to float, warm ocean water can penetrate beneath and enhance melting at the base.
These dynamic ice-sheet processes could lead to a greater rate of sea-level rise than current projections. However, the processes are inadequately understood and are not included in the current generation of ice-sheet models. It is therefore not possible to make robust quantitative estimates of their 21st-century and longer-term contributions to the rate of sea-level rise.
21st Century Sea-level Rise
The Intergovernmental Panel on Climate Change (IPCC) provides the most authoritative information on projected sea-level change. Their Third Assessment Report (TAR) of 2001 projected a sea-level rise of between 20 and 70cm between 1990 and 2100 using the full range of IPCC greenhouse gas scenarios and a range of climate models, and a full range of 9–88cm when an additional uncertainty for land-ice changes was included. In their Fourth Assessment Report (AR4), the sea-level projections using a much larger range of models are 18–59cm (90% confidence limits) over the period from 1980–2000 to 2090–2100. Allowing for the ice sheet uncertainties discussed above, IPCC AR4 increased the upper limit of the projected sea-level rise by 10–20cm and stated that “larger values cannot be excluded, but understanding of these effects is too limited to assess their likelihood or provide a best estimate or an upper bound for sea-level rise”. While the two projections are somewhat different in how they treat ice sheet uncertainties and the confidence limits quoted, a comparison of the projections shows the end results are similar, except that the lower limit of the TAR projections has been raised from 9 to 18cm.
From the start of the IPCC projections in 1990 until 2006, observed sea level has been rising more rapidly than the central range of the IPCC model projections and near the upper end of the total range of the projections, indicating that one or more of the model contributions to sea-level rise is underestimated.
Longer-term Projections
For the next few decades, the rate of sea-level rise is partly locked-in by past emissions and will not be strongly dependent on early 21st century greenhouse gas emission. However, sea-level projections closer to and beyond 2100 are critically dependent on future greenhouse gas emissions, with both ocean thermal expansion and the ice sheets potentially contributing metres over centuries for higher greenhouse gas emissions. There is increasing concern about the longer-term contributions of the ice sheets. For example, for the Greenland Ice Sheet, global average temperature increase relative to pre-industrial values of greater than 3.1°C (with a range of 1.9°C to 4.6°C) leads to surface melting exceeding precipitation, resulting in an ongoing wastage of the Greenland Ice Sheet for centuries and millennia, consistent with sea levels in the last interglacial period being several metres higher than today’s value. This threshold or ‘tipping point’ could potentially be crossed late in the 21st century if effective mitigation measures are not adopted. A second cause for concern is associated with the poorly understood dynamic responses of the Greenland and West Antarctic Ice Sheets that could lead to a significantly more rapid rate of sea-level rise than from surface melting alone.
Key Messages
There is clear scientific consensus that sea level is rising in response to emissions of greenhouse gases from human activity and could be measured in metres without significant reduction in emissions. At the same time, we are living ever closer to the coast and coastal development is continuing to occur. Many of the world’s major megacities are on the coast and growing rapidly. These developments will make the issue of climate change and sea-level rise even more acute.
It is important to recognise that the ocean and the ice sheets have long response times. Stabilisation of greenhouse gas concentrations (requiring a significant reduction in emissions) would result in surface temperatures rising at a much slower rate for decades. However, ocean thermal expansion only decreases slowly and thus sea-level rise will continue (albeit more slowly) for centuries. These long response times mean that no matter how successful we are in mitigating the emission of greenhouse gases, we will need to adapt. The impact of sea-level rise will be felt most acutely through extreme events – coastal flooding events of a given level will occur more frequently and the largest flooding events will be more severe. The least developed countries and the poor are most at risk. Increasing numbers of environmental refugees will be an inevitable consequence of continued sea-level rise.
Successful adaptation could significantly reduce the impact of sea-level rise. For adequate adaptation planning, we need to narrow the current uncertainties. Particularly important is the development and maintenance of observing systems to observe sea-level change and the contributions to this change. To address both the mitigation and the impact of sea-level rise, we need to develop partnerships between science, governments, business and the community. It is important we start planning early. One example of early planning is the investment of billions of pounds to upgrade the Thames Barrier to protect the City of London from rising sea levels and storm surges.
Sea-level rise is happening now and is beginning to have real impact.
Acknowledgements
This paper is a contribution to the Commonwealth Scientific and Industrial Research Organisation (CSIRO) Climate Change Research Program and the CSIRO Wealth from Oceans Flagship and was supported by the Australian Government’s Cooperative Research Centres Programme through the Antarctic Climate and Ecosystems Cooperative Research Centre.
More Information
- Anthoff, D. el al., 2006. Global and regional exposure to large rises in sea-level: a sensitivity analysis. Tyndall Centre for Climate Change Research, Working Paper 96.
- Woodworth, P. L. and D. L. Blackman, Evidence for systematic changes in extreme high waters since the mid-1970s, J. Climate, 17, 1190-1197, 2004.
- Church, J.A. et al., 2006. Sea-level rise around the Australian coastline and the changing frequency of extreme events. Australian Meteorological Magazine, 55, 253-260.
- Emanuel, K. 2005. Increasing destructiveness of tropical cyclones over the past 30 years. Nature, 436, 686-688.
- Webster, P.J., et al. 2005. Changes in Tropical Cyclone Number, Duration, and Intensity in a warming Environment. Science, 309, 1844-1846.
- Overpeck, J. T. et al., 2006. Paleoclimatic evidence for future ice-sheet instability and rapid sea-level rise, Science, 311, 1747-1750, 2006.
- Church J.A. et al., 2001. Changes in Sea Level, In Climate Change 2001: The Scientific Basis. Contribution of Working Group 1 to the Third Assessment Report of the Intergovernmental Panel on Climate Change. Houghton, J.T., Y. Ding, D.J. Griggs, M. Noguer, P. van der Linden, X. Dai, K. Maskell and C.I. Johnson, eds, Cambridge University Press. 639-694, 2001.
- Fairbanks, R.G. 1989. A 17,000-year glacio-eustatic sea level record: influence of glacial melting rates on the Younger Dryas event and deep-ocean circulation, Nature 342, 637-642.
- Lambeck, K. et al., 2004. Sea level in Roman time in the Central Mediterranean and implications for recent change, Earth Planet Sc. Lett., 224, 563-575, 2004.
- Donnelly, J. P. et al., 2004. Coupling instrumental and geological records of sea-level change: Evidence from southern New England of an increase in the rate of sea-level rise in the late 19th century, Geophys. Res. Lett., 31, L05203.
- Gehrels, W. R. et al., 2005. Onset of recent rapid sea-level rise in the western Atlantic Ocean, Quaternary Sci Rev, 24, 2083-2100.
- Gehrels, W. R. et al., 2006. Rapid sea-level rise in the North Atlantic Ocean since the first half of the nineteenth century, The Holocene, 16, 949-965.
- Church, J. A., and N. J. White, 2006. A 20th century acceleration in global sea-level rise, Geophys. Res. Lett., 33, L01602.
- Nerem, R.S. et al., 2006. Present-day sea-level change: A review. External Geophysics, Climate and Environment, 338, 1077-1083.
- Antonov, J. I. et al., 2005. Thermosteric sea level rise, 1955-2003, Geophys. Res. Lett., 32, L12602, 2005.
- Willis, J. et al., 2004. Interannual variability in upper-ocean heat content, temperature and thermosteric expansion on global scales. J. Geophys. Res., 109, C12037.
- Kaser, G. et al., 2006. Mass balance of glaciers and ice caps: Consensus estimates for 1961-2004. Geophys. Res. Lett., 33, L19501,
- Lemke, P. et al., 2007. Observations: Changes in Snow, Ice and Frozen Ground. In Climate Change 2007: The Physical Science Basis. Contribution of Working Group I to the Fourth Assessment Report of the Intergovernmental Panel on Climate Change. Cambridge University Press, Cambridge, UK.
- Zwally, H. J. et al., 2002. Acceleration of Greenland Ice-Sheet Flow, Science, 297, 218-222.
- Rignot, E. et al., 2004. Accelerated ice discharge from the Antarctic Peninsula following the collapse of the Larsen B ice shelf, Geophys. Res. Lett., 31, L18401.
- IPCC, 2007. Climate Change 2007: The Physical Science Basis, Summary for Policy Makers. Contribution of Working Group I to the Fourth Assessment Report of the Intergovernmental Panel on Climate Change. Cambridge University Press, Cambridge, UK.
- Rahmstorf, S. et al., 2007. Recent Climate Observations Compared to Projections. Science, 316, 709.
- Gregory, J.M., and P. Huybrechts, 2006: Ice-sheet contributions to future sea-level change. Phil. Trans. Roy. Soc. Lond. Ser. A, 364, 1709-1731.
Note from the Editor
This article, as submitted by the authors, contained many references. The authors will gladly supply the original article with the references to interested readers. You can also find them with the online version of this article, on the Hydrointernational website.
* This article is based on the Roger Revelle Lecture presented by John Church at the Intergovernmental Oceanographic Commission (IOC) of UNESCO’s 39th Executive Council (2006). The article is a condensed version of the paper that appeared in the 2006 IOC Annual Report.

Value staying current with hydrography?
Stay on the map with our expertly curated newsletters.
We provide educational insights, industry updates, and inspiring stories from the world of hydrography to help you learn, grow, and navigate your field with confidence. Don't miss out - subscribe today and ensure you're always informed, educated, and inspired by the latest in hydrographic technology and research.
Choose your newsletter(s)


