Solving the Uncertainty Management Puzzle
Understanding the Limitations of Instrumentation
As shipping companies continue to make their operations more cost efficient and environmentally friendly, the demand for high density data has increased. Uncertainty management is a cornerstone to sound Geomatics practice and it’s the uncertainty values that will drive the next generation high density bathymetry surveys.
The main goal of uncertainty management is to allow a survey organisation to accurately determine their adherence to international survey specifications (e.g. IHO S44 5th Edition) and/or to internal specifications. Having realistic estimates for uncertainty, hydrographic surveyors can use this information to adequately design, plan and execute survey methodology and special procedures to ensure that the bathymetric data realistically meets the expectations of the desired clients or products.
There are modern processes and practices that can help us provide more realistic uncertainty estimates or help minimise influential components that are difficult to measure or model. This article examines multi-beam (beam-formers) operations utilising the latest advances in hardware, software and modelling approaches.
Uncertainty Estimation
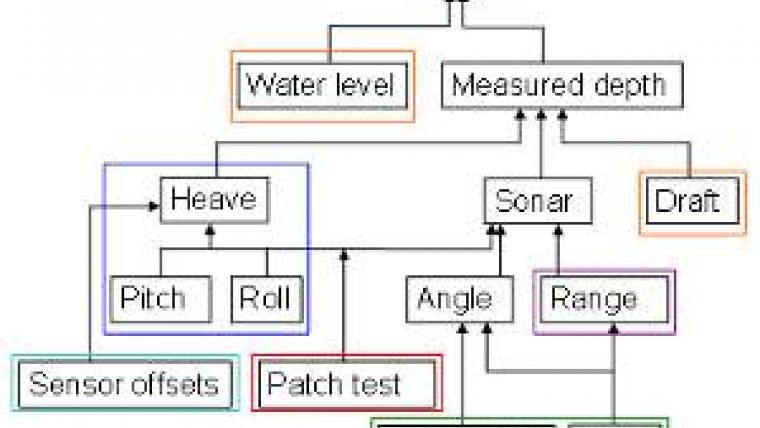
There are components of the total vertical (Figure 1) and horizontal (Figure 2) uncertainty budget that come from the sonar, from the positioning system, from the motion sensor, from sound speed determination, from vessel dynamics, from tidal measurement and modelling, or from RTK heights combined with datum separation modelling, from calibration and from time synchronisation of sensors. In the past, in order to estimate some of these uncertainty inputs, we relied on manufacturer's specifications, predictive models and outright guesswork.
Known Puzzle Pieces
Table 1 (below on the page) demonstrates that very few real-time or post-mission improved uncertainty estimates were available in order to improve upon our a priori (in advance) estimation of TPU (Total Propagated Uncertainty). But in the intervening decade and a half since the initial efforts of 1995, many great strides have been taken to improve this situation.
Position and Motion Sensor
POSPAC MMS (from Applanix Corporation) can output real-time uncertainties, as determined by the POS M/V, or improve upon these uncertainties in post-mission. These values are easily imported into the CARIS HIPS work structure for subsequent TPU computations. The real advantage comes from TPU computations using real conditions encountered as the data was collected instead of using a priori values that are held constant for the entire data collection.
Sound Speed
One of the largest contributors to multi-beam uncertainty is water column sound speed structure and sound speed at the sonar head. As can be seen from Figure 1 and Figure 2, these will contribute to both the range and angle determination of the sonar. Surface SV and SVP are the measurement uncertainties of the instrumentation used for measurements at the sonar and for profiling respectively. To ensure that these are always known, standard operating procedure requires that we have a sound speed sensor at the sonar face continuously recording and that we use an MVP (Moving Vessel Profiler) at a sufficiently high deployment frequency. Using a higher sampling rate provides a reliable assumption that the spatio-temporal effects are minimised or eliminated. Other tools like Uncertainty Wedge Analysis have also proven valuable for estimating uncertainty due to sound speed changes.
Lever Arms
Lever arms (sensor offsets) can be measured using conventional survey techniques. By design, inter-sensor distances should be kept as short as possible in order to minimise their significance on TPU. Proper angle/distance standard deviation calculations using the errors associated with reading, pointing, centering and levelling will be used to compute observation uncertainties. The final lever arm uncertainties should be in the 1cm range so as to not be a significant influence on the total uncertainty budget. Regardless of the desired standard deviations, the a posteriori (after the fact - using real measurements) coordinate variances should be used to compute realistic estimates of the lever arm uncertainties. Other techniques such as laser scanning and close range photogrammetry have been investigated.
Static draft/Squat/Loading
Static draft can be measured using a bar lowered to 2 metres below the sonar head. Before making this measurement, surface sound speed and a valid profile are recorded and entered in the multi-beam. The total uncertainty is a combination of the uncertainty in the 2 metre marking and base uncertainty for a sounding at 2 metres (and the uncertainty in holding the bar marks at water level (which may be moving)). These are then compared/combined with the terrestrial waterline value determined during the vessel coordinating survey. This procedure is repeated while the vessel is subjected to loading changes (fuel consumption) to determine the effect this has on the static draft adjustment at time of survey.
Vessel squat can be measured by several techniques. A line is chosen and run at various speeds while recording both accurate GNSS antenna height (PPK or RTK) and corresponding bathymetry. The time series of heights or overlapping lines of bathymetry are analysed to determine the difference in elevation at each speed. Uncertainty can be determined from the mean uncertainty of the GNSS height solution, from the standard deviation of the bathymetry results, or a weighted combination of both. Ellipsoidally referenced surveys (ERS) can minimise or eliminate the uncertainty due to vessel motion such as squat and loading. Although this method can be used to remove these sources, they will also introduce new uncertainties such as the Geoid, and Sea Surface Topography. The choice of methodology depends entirely on the complexity of the survey, and the chosen method should be one that introduces the least amount uncertainty into the final solution.
Unknown puzzle pieces
While we have improved our methods of estimating the parameters mentioned above, there are other areas where our estimation methods could be improved. These are outlined in the following sections.
Sonar misalignment residuals
The relative alignment between sonar and IMU, the Patch Test, is the cornerstone of calibration for multi-beam system setup. It serves to solve the residual angular misalignments that exist after each individual sensor is surveyed with respect to the vessel reference frame (Roll, Pitch and Heading in Figure 1 and Figure 2).
Most software packages approach this calibration by manual interaction, i.e. visually aligning the calibration lines. This method is limited by the user's own vision and by the actual alignment increment the software allows while 'rotating' the data.
Automated routines do exist (Hypack, SeaCal, QINSy, etc.), which are desirable, but even those do little to address the uncertainty with the final computed values. SeaCal (developed by Norwegian Defence Research Establishment) is probably the most robust automated solution in use today. It utilises a least-squares approach to solve for the unknown offsets. It can compute uncertainty for the measured offsets, but due to the unknown stochastic properties of the observables, the final result tends to be very optimistic.
Sonar measurement uncertainty
An unknown puzzle piece has been the range and beam angle uncertainty associated with each beam from the sonar. To date, the sonar component of TPU has been empirically modelled as a function of frequency, beam width, pulse length, etc. This does not capture the quality of the sonar data during actual conditions, including seabed reflectivity, complexity, noise in the water column, etc.
One new tool to address this issue, which has shown promising results, is the Quality Estimator (IFREMER). This estimator is derived from the acoustic signal of the detection and can be used in place of Range in Figure 1 and Figure 2.
The real advantage to this technique is that it removes the difficulty of modelling uncertainty for wideband sonar systems. CARIS HIPS requires a full description of the sonar parameters at each frequency, which could require many entries for some modern multi-beams.
Vertical Datum
The last remaining puzzle piece is the vertical datum. If we consider the traditional tidally-determined datum reduction for sounding data then the uncertainty would be a function of measurement, datum determination and zoning (interpolation/extrapolation). The measurement is a function of calibration, ocean effects and sampling frequency (filtering sea surface noise). The two biggest unknowns are datum determination and zoning. Hydrodynamic models and GNSS buoys could help solve or mitigate the uncertainty related to these factors.
Considering GNSS datum reduction (e.g. as used on ERS or ellipsoidally-referenced surveys), the total uncertainty requires an estimate of uncertainty of the GNSS antenna height, the measurement of the lever arm between the sonar and the GNSS antenna, the roll and pitch measurements needed to reduce the lever arm motions and the geoid. If GNSS heights are to be referenced to tidally based datums, which are common in hydrographic surveying, we have to include the uncertainty of the separation model which includes many of the elements previously mentioned for the traditional method, plus that of sea surface topography (SST).
Summary and Conclusion
We have seen an evolution over the last decade and a half from largely empirically-based and a priori estimation of uncertainty parameters towards more robust and rigorous uncertainty parameter estimation based on sound physical and statistical theory. There are still a few pieces of the puzzle to be solved, but as Table 2 below indicates, these are steadily getting fewer.
More Information
- Beaudoin, J. 2010. Real-time Monitoring of Uncertainty Due to Refraction in Multi-beam Echo Sounding, The Hydrographic Journal, No. 134 (Autumn 2010)
- Bjørke, J.T. 2005. Computation of calibration parameters for multi-beam echo sounders using the least squares method, IEEE Journal of Oceanic Engineering, Vol. 30, No. 4, October 2005, pp. 818-831
- Hare, R., A. Godin and L. Mayer. 1995. Accuracy estimation of Canadian Swath (multibeam) and Sweep (multi-transducer) sounding systems, Internal report, Canadian Hydrographic Service, Department of Fisheries and Oceans and Ocean Mapping Group, University of New Brunswick, 247 pages.
- Lurton, X., Y. Ladroit and J.M. Augustin. 2010. A Quality Estimator of Acoustical Sounding Detection. International Hydrographic Review. 21 pages.
Table 1 - legacy uncertainty parameter estimation (circa 1995); the colour-coding refers to the coloured boxes in Figure 1 and Figure 2.
| Uncertainty parameter | How determined | Comments |
| Sonar range and beam angle | Empirically-derived sonar-specific model | Provided by Kongsberg; adapted to other sensors using best fit with some field data |
| Roll, pitch, heading, heave | Motion sensor manufacturer's specification for instrument | A priori (estimated in advance) |
| Patch test residuals (roll, pitch, heading) | Usually, half the manufacturer's specifications for the motion sensor, but sometimes same uncertainties as motion sensor | A priori |
| Dynamic draft | Educated guesswork, possibly based on some squat tests and repeated measurements of the vessel under different loading conditions | A priori |
| Surface sound speed (Surface SV in Figure 1 and Figure 2) | SVP manufacturer's specification for instrument | A priori |
| Profile sound speed (SVP in Figure 1 and Figure 2) | Simple two-layer uncertainty propagation based on estimate of spatio-temporal change since last cast was taken | A priori |
| Tides or water levels, incl. vertical datum determination | Educated guess work depending on quality of constituents, proximity to nearest gauge, method of spatial prediction | Provided by tidal analyst on a case-by-case basis |
| Positioning system | Manufacturer's specification for instrument and positioning method or software used | A priori |
| Sensor lever arms | Estimated standard deviation of coordinates for sensors | Based on method used to survey in each sensor in the boat coordinate system (e.g. cloth tape, Electronic Distance Measurement (EDM), photogrammetry) |
| Latency correction | Estimates only | Fixed value, perhaps based on some testing |
| Uncertainty Parameter | How determined | Comments | Status |
| Sonar range and beam angle | Sound theoretical model based on real S/N of each instrument (Lurton QF) | Implemented for RESON and Kongsberg beam-forming sonar systems, with other manufacturers slowly getting on board | Work in progress. Still need an estimate of sonar angular uncertainty. Still work to do on phase-measuring bathymetric side-scans |
| Pitch, roll, heading, heave | Real-time and post-mission estimates | E.g. POS/MV, TrueHeave, POSPAC MMS | Need more motion sensor manufacturers to get on board |
| Patch test residuals (roll, pitch, heading) | Realistic outputs from e.g. SeaCal | Based on least-squares estimation approach | Essentially solved, although estimates may be a bit optimistic |
| Dynamic draft | Use an ERS approach | But, we introduce some new uncertainties - see below in table | Can be eliminated, but uncertainty of datum separation models requires more research. |
| Surface sound speed | SVP manufacturer's specification for instrument | Real-time measurement at the transducer face, apply to beam steering/forming in real-time | Essentially solved |
| Profile sound speed | Rapid sampling of spatio-temporal sound speed structure, using e.g. MVP | Use uncertainty wedge analysis to estimate realistic values for amount to uncertainty introduced | A controllable uncertainty source in all but extremely dynamic oceanographic environments |
| Tides, incl vertical datum | Use an ERS approach | But, we introduce new uncertainties, see below in table. | Can be eliminated, but uncertainty of datum separation models requires more research |
| Positioning system | Real-time and post-mission estimates | e.g. POS/MV, delayed heave, POSPAC MMS | Need more positioning / motion sensor manufacturers to get on board |
| Sensor lever arms | Estimated standard deviation of coordinates for sensors | Proper over-determined sensor survey with output variance-covariance matrix of coordinates | Can be computed effectively |
| Latency correction | Can be eliminated, or at least reduced to negligable if using precise time protocols, or similar approaches to precisely synchronise all sensors | IEEE 1588-2002 PTP based on a network time protocol that effectively eliminates dynamic motion residuals due to small timing errors in the instrumentation. | A solvable problem with some hardware and software |
| Dynamic lever arm | If using ERS approach, need to model incertainties in roll, pitch, lever arm, in order to reduce antenna ellipsoidal height to sensor | Can be computed effectively | |
| Vertical datum separation model | Must be modelled if using ERS approach to remove tides and dynamic draft | This task may prove as chaellenging as estimate tidal uncertainties. It includes oceanographic regime understanding, SST and geoid uncertainties. | Needs more research |

Value staying current with hydrography?
Stay on the map with our expertly curated newsletters.
We provide educational insights, industry updates, and inspiring stories from the world of hydrography to help you learn, grow, and navigate your field with confidence. Don't miss out - subscribe today and ensure you're always informed, educated, and inspired by the latest in hydrographic technology and research.
Choose your newsletter(s)


