Successful Delivery of Coastal Survey Data to the Royal Australian Navy
IHO Order 1b Bathymetric Lidar Data
Amongst the largest contracted coastal hydrographic Lidar survey projects awarded in recent years is the Australian Hydrographic Service (AHS) survey of the Torres Strait in Northern Queensland. The intent of this very large survey was to update nautical charting in the region, facilitate safer navigation and enhance the capacity of maritime enforcement vessels to protect and secure Australian waters from incursions by illegal foreign fishing vessels. As it was to be used for international chart products, the survey data had to be of an accordingly high standard.
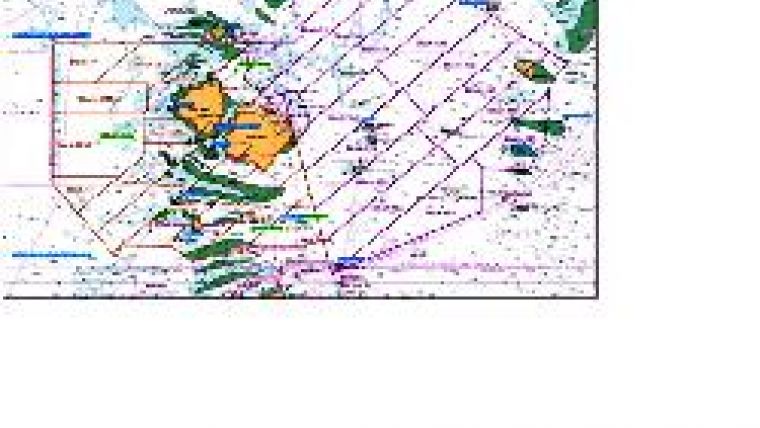
Approximately 850km north from Cairns, the Torres Strait forms the confluence between the Coral Sea (Pacific Ocean) to the east and Gulf of Carpentaria (Indian Ocean) to the west. Averaging around 13 metres deep, this 70km-wide strait between Cape York, Australia's northernmost tip, and Papua New Guinea is festooned with drying reefs, and has isolated rocks, huge areas of mobile seabed, and an extraordinarily dynamic tidal regime (Figure 1), all of which have likely contributed to it being very poorly charted.
Surveyed by Fugro over two seasons in 2007 and 2008 using Fugro Pelagos' SHOALS 1000T bathymetric Lidar system (Figure 3), this major programme had to meet the criteria for International Hydrographic Organization (IHO) Order 1b surveys, which requires the same stringent horizontal and vertical positional accuracies for bathymetric data as Order 1a, although relaxing the 1a target detection criterion, which specifies an ability to detect features in the order of 2m3 in depths of up to 40 metres as a minimum acceptable standard.
Acquisition of bathymetric and topographic Lidar data involved operating the system at an altitude of 400 metres with it set to acquire elevation data at 3x3m spot spacing. Concurrent aerial imagery and metadata collection facilitated the quality control and assessment of the survey.
System Description
The SHOALS 1000T system uses a solid state Nd:YAG (Neodymium-doped Yttrium Aluminium Garnet crystal) pulsed dual frequency laser to output simultaneous pulses at 532nm (green beam) and 1064nm (near infrared beam). The infrared beam is used to detect the water surface and does not penetrate it. The green beam penetrates the water and is used to detect the sea floor. A moving average window is used to create a mean water surface, in order to remove wave action and heave, so that tides may be applied. The integral Applanix POS AV410 IMU measured aircraft orientations (roll, pitch and heading). Nadir-oriented digital photographs were also obtained at 1Hz throughout the survey area using an integrated DuncanTech DT4000 digital camera. The digital camera imagery was used during processing to assist in the identification of bathymetric features and aids to navigation.
Acquisition
The remoteness of the work site and complexity of the environment made for extremely challenging logistics, but despite this data acquisition was completed on schedule and within the demanding specifications defined. Weather, water clarity and tides significantly constrained data acquisition, so that operations tended to be executed during brief favourable windows of opportunity. These periods related closely to the spring and neap tidal cycles, which in turn dictated the degree of sediment transportation, and thus turbidity levels, in the area.
During the peak period of production, Fugro was surveying to nautical charting standards at a rate of 160km2 per day. This almost unprecedented output was made possible using an augmented field team operating around-the-clock at a 4-flight-per-day tempo, which resulted in very high in-flight ratios for over 30 days of the overall field effort. During this period, a very high level of availability was maintained for the aircraft, the Lidar system as a whole and the rugged remote broadband communications established with FPI's main processing centre in San Diego.
Tidal Regime
The project encompassed an extremely complex tidal regime, which transformed from a mainly diurnal to a mainly semi-diurnal pattern across the area. The central portion of the survey had a large rate of change in the ‘age of tide', caused not only by the astronomic harmonic changes but also by the very convoluted system of drying reefs, islands and shoals. In addition, a seasonal mean sea level change of over 0.5m, itself highly variable spatially across the survey area, added to the complexity of the situation.
To resolve this, Fugro installed 18 offshore gauges and 4 shore-based gauges with tide poles (all of which yielded 100% data recovery) and utilised barometric pressure data from a nearby meteorological station to correct the final tide data when the units were retrieved and the data downloaded and processed. This data fuelled a constituent-level TCARI model, originally conceived by National Oceanic and Atmospheric Administration (Hess, 2003), which Fugro further developed for the project. This effort resulted in the successful reduction of soundings and crosscheck agreement in accordance with IHO Order 1 accuracy standards.
Processing and Quality Assurance
Most processing was conducted in San Diego, except for the initial cleaning and processing carried out by the field team to determine adequate coverage and data quality. Good communication and support meant that more information was shared between all parties than is normally provided by a fully manned field acquisition and processing team to the production office, which again aided in the delivery of a quality product.
By reducing each point for a modelled astronomic tide then applying residual value correctors through the TCARI model for the actual corresponding timeframe, the correct adjustment to the sea surface value with respect to the datum was achieved, and from this the actual soundings obtained. The datum offshore was established in Matlab software between trusted shore stations and offshore gauges displaying similar harmonic trends. A computational crossline analysis tool in IVS Fledermaus® was used to statistically determine the overall correctness of the model, given that the crosslines and mainlines were obtained at different states of the tide.
Standard deviation surfaces from the fully processed Lidar data (Figure 2) were created to highlight inconsistencies in overlapping data. This analysis formed the most fundamental Quality Control check of the actual bathymetric data as it incorporated the entire error budget associated with each Lidar shot.
Analysis and Reporting
Fugro reported over 200 Hydrographic Notes to the AHS to consider for further Notices to Mariners (NOTAM) action during the course of the survey. Of these, several were investigated by divers during recovery of tide gauges and an uncharted, 45-metre-long wreck was discovered on the strength of bathymetric Lidar data alone (Figure 4). Data was then compared to existing chart information, internally compared by time series and evaluated in high resolution in the Lidar point cloud, and finally assessed as a fully processed, tidally corrected bathymetric surface for uncharted or unusual seabed features (Figure 5). Amongst the plethora of data analysed - over 14Tb in raw form - various phenomena were observed from this purely Lidar dataset, including:
- Sediment transport: crest displacement of large sand waves was of the order of 12 to 20 metres over a two-day period in the most dynamic regions.
- Potential bioherms of coral or domal stromatolites: if confirmed that these 30 metre diameter features are biological then the discovery of such a massive living entity has some scientific merit.
- Linear pockmarking: a series of clearly aligned pockmark features, some 40 metres in diameter, regularly spaced and in the order of 3 metres deep appeared to be clearly associated with the reef structures and, despite the existence of mobile sediments in the area, seem to either refresh or never permanently fill with sediment.
- Riverine features: two channel systems, each featuring a main, meandering channel and a complex of interwoven tributaries and oxbows, inferred historic deltaic environments.
Summary
Delivery of a hydrographic survey to one of the world's premier hydrographic offices is a challenging endeavour, regardless of the technology used. The primary reasons for success are not just the systems and software used, but also the project management, teamwork between the crews, communications internally and externally with the client and, last but not least, a sound understanding of the client's objectives and goals, as well as those of the end customer. It was the client's considered assessment that the objectives of the survey were fully met. A very thorough examination of all data was made on a variety of fronts, resulting in the delivery of confirmed IHO Order 1b survey data to the AHS.
More Information
Hess, K., 2003. Water Level Simulation in Bays by Spatial Interpolation of Tidal Constituents, Residual Water Levels, and Datums. Continental Shelf Research, 23, pp 395-414.

Value staying current with hydrography?
Stay on the map with our expertly curated newsletters.
We provide educational insights, industry updates, and inspiring stories from the world of hydrography to help you learn, grow, and navigate your field with confidence. Don't miss out - subscribe today and ensure you're always informed, educated, and inspired by the latest in hydrographic technology and research.
Choose your newsletter(s)


