Tidal currents from AIS data
Studying currents in the Gibraltar Straits
Currents are traditionally measured with buoys and drifters, but such surveys are expensive and results are scarce. Almost all ships are equipped with an automatic identification system (AIS), primarily to improve shipping safety. Broadcast AIS signals contain information about the ship’s identity, position, speed and heading. These signals are collected at coastal stations where time stamps are added. The resulting time series make it possible to track individual ships and analyse their movements. This article shows the results of a case study in the Strait of Gibraltar that makes use of freely available AIS data. The method presented turns passing ships into moving buoys to obtain tidal information on surface currents.
AIS data
For our case study we collected AIS data over a period of six weeks from ships passing through the Strait of Gibraltar between 16 May and 30 June 2017. Only ships longer than 100 metres were selected. Data from ships that were manoeuvering or calling at one of the ports along the route were eliminated. This left 1,700 eastbound ships and 1,600 westbound ships from the 4,300 collected AIS data records.
The study area in the Strait of Gibraltar lies between 6°W and 5.3°W. This stretch was divided into 70 bins, each about 900 metres wide. For each ship, AIS data were averaged per bin, to reduce the amount of data and make sure that fast ships contributed as much to the analysis as slower ships.
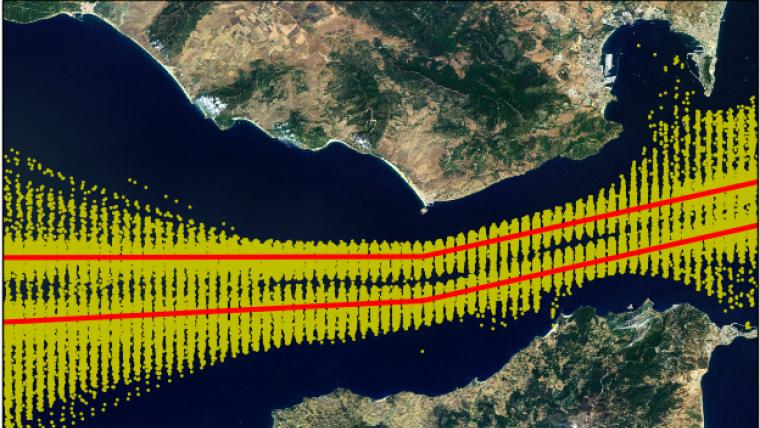
Figure 1 shows the binned ship positions. Two lanes are clearly visible: a northerly for westbound ships out of the Mediterranean Sea and a southerly for eastbound ships into the Mediterranean Sea. The red lines indicate the two tracks along which a tidal analysis was carried out. These tracks have a bend at a longitude of 5.61°W. The eastern part of the track has a direction of 70° and the western part of the track a direction of 90°, reflecting the analysed current component.
Persistent currents
In the Mediterranean Sea, the evaporation of water surpasses the influx of water from rivers and rain. This leads to a steady inflow of water from the Atlantic Ocean. Thus, ships sailing from the Mediterranean into the Atlantic through the Strait of Gibraltar sail against the persistent currents and will be slower than average. Eastbound ships into the Mediterranean will be faster.
To get a first simple and rough estimate we compared the average ship’s speeds in the northern and southern lane for each bin, deducing the persistent surface currents from the difference between these values. This idea works surprisingly well. A much more sophisticated tidal analysis (see below) was performed to assess the persistent currents along the northern and southern lanes. The shapes of the persistent currents as calculated with these two completely different methods are similar and consistent (see Figure 2). As a bonus, the simple method also provides an estimate for the average persistent current along the route, whereas the complex regression method can only assess the shape of the current.
Tidal spectra
Tidal variations have specific, well-known frequencies; the most important are the semi-diurnal (twice a day) constituents M2, S2 and N2, and the diurnal (once a day) K1 and O1. In a traditional tidal analysis, the spectrum of the measured time series is calculated in a Fourier analysis. The spectral peaks show which constituents can be detected and what the amplitudes and phases of the related tidal constants are. This approach does not work for the binned AIS data because the measurements give the ship’s speed and not the currents. In our approach, we assume that the speed of a specific ship is the sum of a constant cruising speed and a contribution from the currents that vary in space and time. The yet unknown cruising speeds range between 3.5 and over 12m/s per vessel and cannot be neglected in a spectral analysis.
To circumvent this problem, we consider for each ship the mean acceleration, a quantity suitable for harmonic analysis. This approach works as the periodogram (Figure 3) showing the three main semi-diurnal and two diurnal tidal constants are visible.
Tidal analysis
The next step is to assess the amplitudes and phases of the main tidal constants in each bin for both the northern and southern lane. For the whole database of binned AIS data, we assess cruising speeds (as a constant per ship) and amplitudes, phases and persistent currents (constant per bin) in one big regression analysis. Only the main three semi-diurnal tidal constants are considered (M2, S2 and N2). The reason for this is that ships cross the study area in about 2.5 to 3 hours, which is short compared to the 24-hour cycle of diurnal tides. The induced speed variations are therefore too small to be separated from the estimated cruising speed. In the results (Figures 4 and 5) the semi-diurnal variations are clearly visible, as well as the spring and neap tidal cycles.
When compared with published model results from another study, in which buoy measurements have been assimilated, the results showed a consistency in the shape of the constants: a peak near the Camarinal Sill near 5.8° W, sloping down towards the east. Also, the magnitude of M2 and S2 are in agreement (N2 was not mentioned in the publication).
This analysis method produces tidal information on the surface current component in the direction of the shipping lane. In a previous study on tracking large eddies with AIS, it was found that cross currents can also be estimated from course deflections. However, this is far less straightforward to implement and in the present case study cross currents are small.
Conclusions and outlook
The results from this study show that ship’s AIS data contain valuable information on surface currents. Where traditional buoy surveys collect accurate point measurements, the AIS analyses provide assessments of tidal constants along a route. An important advantage of this technique is the low costs of data acquisition. AIS data can be collected freely and commercial providers have collected AIS data worldwide for many years and make this data available for a relatively low price. The archived AIS data is mainly available along the densely-navigated shipping routes but, for nautical applications, this is exactly where the information is needed. The assessment of persistent surface currents and of the largest tidal constant M2 was possible after collecting data for only a few weeks. This means that seasonal variations in the persistent currents can also be traced. The assessment of the smaller tidal constants, S2 and N2, is more affected by noise caused by weather, eddies and ship’s manoeuvres in particular.
The research to extract surface current information from AIS data is ongoing. This technique can already provide valuable information in practical applications such as a characterization of the tidal regime in an area or as complementary to a traditional survey. Better filters to detect ship’s manoeuvres, more robust statistical methods and better models will further improve the reliability of the assessment of tidal currents. Also, other information can be extracted: during the study, traces of internal waves were detected in the time series of groups of ships. Finally, AIS databases contain a wealth of information on MetOcean conditions, waiting to be discovered.
More information

Value staying current with hydrography?
Stay on the map with our expertly curated newsletters.
We provide educational insights, industry updates, and inspiring stories from the world of hydrography to help you learn, grow, and navigate your field with confidence. Don't miss out - subscribe today and ensure you're always informed, educated, and inspired by the latest in hydrographic technology and research.
Choose your newsletter(s)


