Southern Ocean Bathymetry
The Scientific Committee on Antarctic Research (SCAR) expert group for the compilation of the new International Bathymetric Chart of the Southern Ocean (IBCSO) proposes to build a consistent bathymetric database for digital ocean mapping of the Southern Ocean together with additional data that covers the ice shields of Antarctica, for example, radar satellite imagery, digital elevation models and free-air gravity from satellite altimetry. Acquisition, storage, compilation, and modelling of the heterogeneous data sets will be realised in a high-end GIS environment with server-GIS capabilities. Digital data processing throughout the work will facilitate the production of traditional printed maps and digital web maps. Hence, the generation of the bathymetric chart will be time- and cost-efficient.
Background
The implementation of a southern equivalent to the International Bathymetric Chart of the Arctic Ocean (IBCAO) was proposed and accepted by an ad-hoc working group during the General Bathymetric Chart of the Oceans (GEBCO) meeting in 2002. The resulting ocean mapping programme for the compilation of the International Bathymetric Chart of the Southern Ocean (IBCSO) was adopted as an IBC mapping project by the Intergovernmental Oceanographic Commission (IOC) Executive Council in 2004. The IBCSO mapping project is now well established within international organisations, for example, the Scientific Committee on Antarctic Research (SCAR), the International Hydrographic Organisation (IHO) and the IOC of UNESCO. The following groups and subcommittees set up IBCSO in an official frame: the SCAR Geosciences Standing Scientific Group, the IOC Consultative Group on Ocean Mapping and the Hydrographic Committee on Antarctica. Additionally, the IBCSO group has liaisons with the SCAR/Scientific Committee on Oceanic Research (SCOR) Expert Group on Oceanography and the SCAR Standing Committee on Antarctic Geographic Information.
IBCSO and the SOGIS
A key objective of the IBCSO is the production of a bathymetric map for the entire Southern Ocean. This comprises printed maps as well as digital web maps for use in GEBCO and other projects. Since the restart of the IBCSO at the end of 2006, the work plan has been modified due to changes in data infrastructure and geographic information systems (GIS) environment. In the course of the IBCSO project, the emphasis shifted from digital ocean mapping towards GIS-based data compilation. Consequent use of digital data in a proprietary GIS environment leads to the build-up of a complex geo-database with extensive meta-information. The proposed name is ‘SOGIS – Southern Ocean Geographic Information System’. The IBCSO Expert Group may develop from a solely ocean mapping programme into an international and interdisciplinary forum for Antarctica and the Southern Ocean.
The technological strategy implies collection and integration of existing geophysical and geological data sets together with topographical and bathymetric data for Antarctica and the entire Southern Ocean. Geophysical data of marine gravity acquired by satellite altimeter and mapping of lithospheric magnetic anomalies provide subsurface information of predominant tectonic structures and magnetic spreading anomalies. The potential field anomalies are highly correlated with morpho-structural features of the oceanic crust.
Another main objective is to collect and compile bathymetric data sets with additional seamless data derived from radar satellite images (for example, Radarsat Antarctic Mapping Project), satellite altimetry and marine gravity that presently reside in numerous national and international databases and repositories. These data sets are maintained by a great number of research institutes, universities, agencies and related data centres from many countries. Search and acquisition of existing echosounding data is one of the crucial factors in digital ocean mapping. Narrow single- and multi-beam data of the Southern Ocean are scattered throughout the world and documentation is often poor. These factors might hamper the integration of data to the IBCSO database management system, SOGIS. The IOC Consultative Group on Ocean Mapping recommends close collaboration with the IOC, IHO and SCAR, especially in the acquisition of new data and the retrieval of existing data from a great number of data centres and repositories.
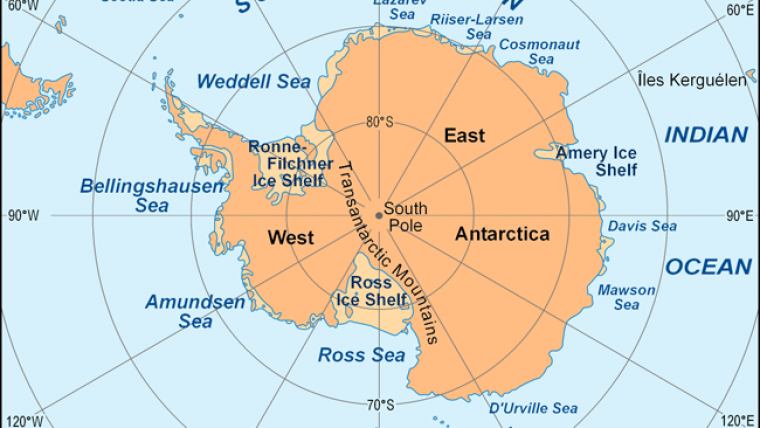
The bathymetry group of the Alfred Wegener Institute (AWI) hosts one of the largest databases with mainly multi-beam data for polar areas. As a result, the Bathymetric Chart of the Weddell Sea (BCWS) was published by the AWI in co-operation with the Vernadsky Institute, Russia. This map series consists of one master sheet at a scale of 1:3,000,000 and nine sheets at a scale of 1:1,000,000. It covers the area between 66°W-2°E and 60°S-78.5°S. Compilation and contouring are in accordance with IHO standards. New data were collected by the AWI in the areas of Bellinghausen, Amundsen Sea, Scotia Sea and Northern Weddell Sea. A new bathymetric chart of the Ross Sea has been compiled by New Zealand. These data cover parts of the South Pacific and will be integrated with the IBCSO database. Russian data cover large areas of the southern Indian Ocean including Prydz Bay, Cooperation Sea, Cosmonaut Sea, and Riiser-Larsen Sea. Australian data also cover parts of the southern Indian Ocean. Bathymetric data are integrated from the National Geophysical Data Center (NGDC), the IHO Data Center for Digital Bathymetry (DCDB) and the SCAR Antarctic Digital Database (ADD). There are many more patches spread worldwide. Nevertheless, large gaps occur – especially in the South Pacific. To fill these gaps, global data from the GEBCO (GEBCO Digital Atlas, 2003) and ETOPO2 (2006) will be merged with the high-resolution single- and multi-beam data.
Echosounding data is heterogeneous in terms of age, acquisition systems, accuracy, pre-processing and documentation. The great variety of analogous maps, digital data types and data formats necessitate the use of GIS for data collection, storage, manipulation and visualisation. Consistent integration of the diverse data sets is assured in a GIS environment with extensive data import and export capabilities.
Why Ocean Mapping?
Analysis and modelling of the SOGIS data sets enable the generation of paleobathymetric maps with special emphasis on submarine gateways and barriers for an updated plate tectonic reconstruction of the Southern Ocean. Another application is the correlation between variations in gravity anomalous roughness and their relationship to topographic lineaments in the abyssal plains. This relationship could be diagnostic for the tectonic heterogeneity of the oceanic crust, because transform faults cannot be identified primarily by echosounding data due to marine sediment coverage. Therefore, the knowledge of fault patterns assists the estimation of crustal behaviour, for example, localisation of potential earthquake hypocentres for use in tsunami early-warning systems. GIS-based analyses of bathymetric data do not only provide water-depth information, but also derived digital terrain model parameters, for example, slope, aspect, curvature and terrain variability. Multi-scale terrain analyses of multi-beam data are important descriptors for benthic habitat mapping. The partially ice-covered continental slopes of Antarctica are sensitive ecosystems and habitat mapping may deliver characterisation of bathymetric features in their regional context to marine researchers, for example, the Bathymetric Position Index (BPI). Bathymetric data are also essential for the production of reliable nautical charts for safe navigation. Unfortunately, the depth and shape of sea floor topography measured by acoustic echosounding systems are largely unknown. Large gaps in bathymetric information occur especially in the polar areas with limited access due to the severe climatic conditions and extensive sea ice coverage.
News
For the revitalisation of the IBCSO expert group, a first IBCSO business meeting was held during the 10th International Symposium on Antarctic Earth Sciences at the University of California, Santa Barbara. Individuals from fields of bathymetry, ocean mapping and data infrastructure participated in the meeting. Major topics covered were the establishment of the IBCSO editorial board and prospective strategies in data collection and distribution. There is more detailed information and news available about the IBCSO mapping programme ( 8 1). For further information, contact Norbert Ott and Hans Werner Schenke from the Bathymetry and Geodesy Group at the Alfred Wegener Institute for Polar and Marine Research, Germany.
Acknowledgements
We acknowledge provision of data and information from many facilities and related data centres, for example, the Alaska Satellite Facility (ASF), the Australian Antarctic Division (AAD), the Alfred Wegener Institute (AWI), the British Antarctic Survey (BAS), Geoscience Australia (GA), the Lamont-Doherty Earth Observatory (LDEO), the Ohio State University (OSU), the National Institute of Water and Atmospheric Research (NIWA), the National Geophysical Data Center (NGDC), the National Snow and Ice Data Center (NSIDC), the Scripps Institution of Oceanography (SIO), the United Kingdom Hydrographic Office (UKHO) and the Vernadsky Institute.

Value staying current with hydrography?
Stay on the map with our expertly curated newsletters.
We provide educational insights, industry updates, and inspiring stories from the world of hydrography to help you learn, grow, and navigate your field with confidence. Don't miss out - subscribe today and ensure you're always informed, educated, and inspired by the latest in hydrographic technology and research.
Choose your newsletter(s)


