Surveying in the Ross Sea
The deepwater research vessel Tangaroa of the National Institute of Water & Atmospheric Research (NIWA) of New Zealand undertakes regular research expeditions to the Antarctic waters. In the last eight years, this 70m ice-strengthened vessel has successfully completed seven voyages to Antarctica: three of which were to the Ross Sea. This article describes her 48-day voyage in 2006. During this latest voyage, she once again collected data to extend our knowledge of the geophysical and biological make-up of the Ross Sea region
Looking Back
Tangaroa ’s first voyage to the Ross Sea was in February–March 2001, when it undertook a hydrographic survey for Land Information New Zealand (LINZ). LINZ required hydrographic survey work to be completed for the production of nautical charts of the Cape Adare to Cape Hallett region, including the Possession Islands and, further north, the Balleny Islands. The charts are required to ensure the safe passage and anchorage for the increasing number of vessels visiting the area. The lack of authoritative hydrographic charts constituted a considerable risk for stranding, holing or sinking of these vessels, which would, given the extreme nature of the Antarctic, likely result in a major human and/or environmental disaster.
The 2001 survey resulted in the production of four new charts: NZ 149006, 149007, 149008 and Balleny Islands chart NZ 149012. Some marine biodiversity information was also gathered along the coastal margin during this voyage.
Tangaroa returned to the Ross Sea in January 2004, this time for a joint LINZ–Ministry of Fisheries (MFish) survey. LINZ required further hydrographic data to be collected in the new chart areas to fill in data gaps left after the 2001 survey as a result of the ice conditions and the short survey season. NIWA also undertook transect surveys to collect biological information across the continental shelf for MFish. This biodiversity study was carried out to assess and document the biodiversity of the Ross Sea region and support the conservation and sustainable management of its marine resources. LINZ is currently publishing updated editions of the charts, which will include the 2004 hydrographic survey data, and analysis is underway for the biodiversity data.
Planning and Risk Mitigation
Surveying in the extremes of the Antarctic requires considerable planning and risk mitigation. Other than the occasional fishing, research and cruise vessels, help is often more than eight days away. There is no air support or means of evacuating any personnel following the closure of the bases and associated air service in mid-February. As a result, the preparation for such a voyage involves rigorous safety and emergency provisions. Firstly, we prepare a specific risk management plan for the voyage and an emergency response plan, with the nearest support at any time identified. On the medical side, we required all expeditioners to complete rigorous medical and dental examinations, and the expedition carried a medical doctor and appropriate hospital facilities on board. To ensure the safety of the team in Antarctic conditions, all expeditioners completed cold weather survival training and were provided with personal survival kits. In addition, we installed a self-sufficient survival container on Tangaroa’s deck and established an emergency cache of survival and food onshore at Cape Hallett to be used in the event of vessel abandonment. To cope with the difficult weather and ice conditions in the Antarctic, we included an ice pilot as part of the crew and commissioned ice assessment studies, along with daily ice and weather specialist support.
Organising the menu and food for 37 people working in shifts over seven weeks also takes considerable planning. For the 2006 voyage, Tangaroa ’s store was stocked with, among other things, 300 loaves of bread, 150 dozen eggs, 660 litres of fresh milk, 440 kilograms of potatoes and 6,000 tea bags. Anyone who has been on an Antarctic expedition knows just how important it is to have regular hot meals. To keep everyone going, the two cooks turned out two choices of cooked food three times a day, every day, regardless of sea conditions.
Ross Sea 2006 Voyage
This voyage was funded by LINZ to undertake geophysical and scientific studies of the Ross Sea continental shelf area. The survey was in support of the New Zealand Government’s Ocean Survey 20/20 (OS 20/20) initiative to survey and provide knowledge of its oceans. As an OS 20/20 partner, MFish contributed to the voyage to support further biological studies. The aim was to carry out:
- geophysical surveys (seismic and multi-beam bathymetry)
- biodiversity studies of the Ross Sea, Scott and Balleny Islands (MFish)
- coastline mapping and hydrographic surveys of Scott Island
- extension of the previous hydrographic surveys and coastline mapping of the Balleny Islands
- marine mammal and seabird studies (MFish and Department of Conservation)
- collect other scientific data such as tidal currents, atmospheric weather observations, etc.
Tangaroa set sail from Wellington on 30 January 2006, after four days of mobilisation and system calibration tests, with a team of 37 surveyors, scientists and vessel crew. The vessel arrived in the eastern Ross Sea, north of Cape Colbeck, on 7 February. The team carried out geophysical survey work interspersed with biological sampling, working their way towards Scott Island. On reaching Scott Island on 6 March, the team completed a hydrographic and coastline survey of Scott Island before moving to the Balleny Islands. Further hydrographic and biodiversity survey work was undertaken around the Balleny Islands to extend the previous 2001 and 2004 survey results. Surveys of marine mammals and seabirds were also undertaken at this time.
Tangaroa arrived back in Wellington on 17 March.
The Survey Team
The NIWA-led survey team of multi-skilled personnel were from a number of organisations and countries: marine surveyors, data processors, engineers and biological specialists from NIWA, a seismic processor and gravity technician from GNS Science, navigation and positioning specialists from Fugro BTW New Plymouth and Fugro Survey Australia, two university students assisting with data processing and a consultant Cat-A hydrographer/surveyor-in-charge from Mosaic Hydrographic Services Canada. To complete the team, LINZ provided two geophysical client representatives and MFish provided a biodiversity client representative.
Geophysical and Charting Work
Positioning was achieved using Fugro’s SkyFix XP as the primary positioning system and Fugro’s WADGPS as the secondary system. To achieve the required accuracy, a temporary differential GPS base station was established at Scott Base. This base station provided differential information to Fugro’s worldwide area network, which was then broadcast to Tangaroa via POR and Sat B satellites. Onboard, Tangaroa’s position was supported by a GPS inertial guidance motion sensor, which allows coordinate positions to be transferred to the various sensors around the vessel. Differential corrections were also broadcast from Tangaroa to its workboat for coastline mapping work. SkyFix XP provided sub-metre accuracy while WADGPS provided 4- to 5-metre accuracy.
The geophysical survey comprised the collection of bathymetry, low-fold seismic, magnetic and gravity data recorded along survey lines across the continental shelf. Bathymetry was collected using Tangaroa’s hull-mounted 30kHz Simrad EM300 multi-beam echosounder. This sounder provides complete coverage of hydrographic depth soundings over a swath of the seabed, up to 5km wide, in water depths from 75m to around 5000m. Low-fold seismic information was obtained by firing two air guns to generate a low-frequency sound that travels through the water, penetrates the seafloor and reflects from the underlying geology, then is received by a towed array of hydrophones up to 500m long (known as a ‘seismic eel’). Both the air guns and hydrophones are towed at approximately 10m below the surface behind
Tangaroa. The data collected by the hydrophones are digitised and processed to produce a profile image, up to 3km below the seafloor, of the underlying geological features, including sediment thickness, basement structure and the location of faults.
Tangaroa also used a 3.5kHz hull-mounted sub-bottom profiler, which captures a high-resolution profile section of geological features down to around 80m below the seafloor, depending on bottom type. Local variations of gravity were recorded by an onboard gravimeter and magnetic data is acquired by a towed sensor, all of which support the interpretation of the regional geology.
Hydrographic surveys around Scott and Balleny Islands involved the capturing of hydrographic soundings, along with coastline mapping. Again, Tangaroa’s Simrad EM300 multi-beam echosounder was used to collect soundings in areas deeper than 75m and, when required, its Simrad EM3000D 300kHz high-resolution sounder was used for depths less than 150m. Coastline features were mapped using Tangaroa’s NAIAD workboat and a portable GPS data logger. Weather and ice conditions, and the rugged nature of the coastline dictated that the preferred ‘transiting of the coastline’ (landing on each point) technique could not safely be undertaken. As a result, the workboat was used to obtain several ranges and/or bearings to accurately triangulate the position of each coastal feature. Where the workboat could not be used, the team employed Tangaroa’s range-bearing compass system, though at a slightly lower accuracy. A more accurate coastline was obtained for each island set from these new points and visual observations.
New Position for Scott Island
This voyage provided the first serious hydrographic survey of Scott Island. It was found to be very different in shape, size and position to what had previously been charted. Its location was some 2.3km north of the current charted position and 2.5km southwest of the position provided in the Antarctic Pilot. It is very important to get it right, especially since much of the year the island is shrouded in fog and snow!
Steady as She Goes…
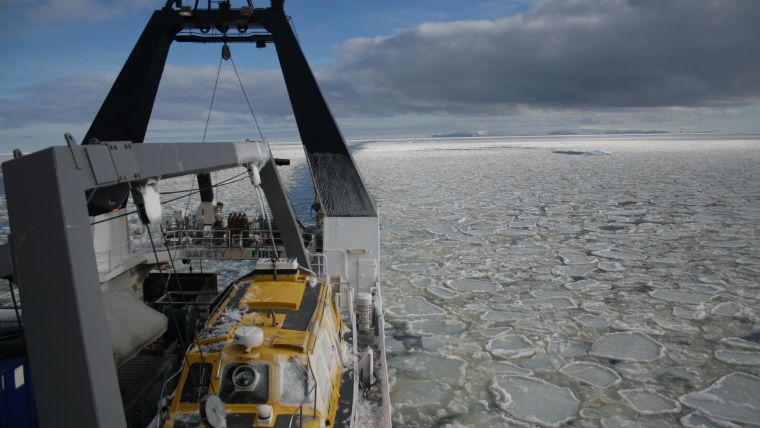
Navigating through the ice required plenty of concentration. The officer of the watch had to pick the most ice-free route without deviating too much or too sharply from the survey line. This meant looking well ahead to avoid heavy pack areas and trying to ensure that the ‘bergy bits’ and ‘growlers’ (small icebergs 1–5m above and less than 1m above the sea surface,respectively) did not collide with thetowed array of sensors. Navigating through the ice in poor visibility is not an easy task.
To help plan the survey operations, daily weather information and forecasts were obtained from both the Australian Bureau of Meteorology in Hobart and the New Zealand MetService. We also obtained daily ice navigation information from Enfotec Canada. Enfotec provided their IceNav system, which enabled satellite imagery to be transmitted from Canada via e-mail and displayed on the bridge. In addition to the publicly available satellite images, we obtained new Radarsat satellite imagery to cover the survey areas of high ice concentration a day or so prior to entering these areas.
Tangaroa has a SkyEye receiver from which real-time weather satellite images are received.
NIWA’s 10m survey launch Pelorus was also carried aboard Tangaroa for safety if the vessel needed to be abandoned and for inshore hydrographic survey work. It is a self-contained unit that has been specially modified to protect the occupants from the environment and for operating in a cold environment.
Pelorus was fitted with a single-beam Echotrac DF3200 echosounder, C Max side-scan sonar, TSS DMS 2-25 motion sensor, and Trimble’s HydroPro navigation and data-collection system for inshore surveying.
Some 3,900 line kilometres of geophysical survey data and more than 1,000 square kilometres of hydrographic survey data were collected, processed and delivered to LINZ. These will be used to advance the understanding of the regional geological structure and support hydrographic charting in the Ross Sea.
Biodiversity
The biodiversity study looked at the marine communities on the Ross Sea continental shelf, around Scott Island and Balleny Island sea mounts. It extended the research previously undertaken during the two earlier voyages.
The biodiversity team used an underwater camera system to record still and moving images of the seafloor, bottom-dwelling fish and invertebrates at depths of up to 1,100m. The camera and housing was purpose-built in NIWA’s Wellington workshops. A ‘benthic sled’ was used to collect thousands of specimens from the seafloor. These will be sent to taxonomists at NIWA and elsewhere to identify and describe. Samples of plankton and krill, and measurements of chlorophyll were taken to obtain an indication of the productivity of different parts of the Ross Sea and Southern Ocean, including around Scott and Balleny Islands.
To complete the picture of the marine ecosystem, records were made of the larger animals – seabirds, seals, and whales. The team counted more than 2,500 seabirds belonging to 17 species, including various types of albatross and petrel, and 230 marine mammals including minke and humpback whales, and various seal species. This information will help to give estimates of the distribution, densities and biomass of the larger animals in the Ross Sea ecosystem, which will be used to help construct models of feeding relationships, among other things.
The biological data will be integrated with existing knowledge to build a more coherent picture of life in the Ross Sea. It will provide a better understanding of Antarctica’s ecosystems and environment, and will also provide baseline information to help identify the impact of the growing human presence in Antarctica, including the effects of climate change.
Looking Ahead
Tangaroa is engaged in other OS 20/20 voyages to survey New Zealand’s waters over at least the next five years. Planning is also under way for Tangaroa to return to Antarctica in February–March 2008 as part of an International Polar Year (IPY) initiative. This major international programme will involve a number of nations and research vessels undertaking biological studies around the Antarctic waters as part of the Census of Antarctic Marine Life (CAML) programme. Findings will be used to improve our understanding of Antarctic and Southern Ocean biodiversity and ecosystem functioning, to assist in policy decisions on Marine Protected Areas, in biotechnology and biodiversity discoveries, and to better manage marine living resources through contributions to the Commission for the Conservation of Antarctic Marine Living Resources (CCAMLR).
Acknowledgement
This article was first published in the NZIS Survey Quarterly, December 2006, Issue 48.

Value staying current with hydrography?
Stay on the map with our expertly curated newsletters.
We provide educational insights, industry updates, and inspiring stories from the world of hydrography to help you learn, grow, and navigate your field with confidence. Don't miss out - subscribe today and ensure you're always informed, educated, and inspired by the latest in hydrographic technology and research.
Choose your newsletter(s)


