TeamSurv - Surveying with the Crowd
The Application of Crowdsourcing to Hydrographic Surveying
Modern multi-beam survey techniques offer unprecedented levels of accuracy, but there are many areas where a multi-beam survey is not available or cannot be justified. TeamSurv uses crowdsourcing to offer an alternative approach for these situations.
As any reader of Hydro International will know, modern multi-beam survey methods are several orders of magnitude better in accuracy and coverage compared to even just 30 years ago. But it is also expensive, and the resources may not be available. TeamSurv brings crowdsourcing to surveying, gathering data from vessels as they go about their normal activities, using their standard instruments. It is developing a methodology which will never be as accurate as a multi-beam survey, but can be used as an alternative survey tool. Here we describe the approach taken by TeamSurv, its strengths and limitations, and look at suitable areas of application.
Crowd Power
Crowdsourcing is now an established methodology for collection of geospatial data - examples include OpenStreetMap and TomTom on land, and in the marine sector tools such as TeamSurv, Navionics, OpenSeaMap and ActiveCaptain. Whereas crowdsourcing is open to all, there are also similar closed communities, such as Olex users, sharing data. The underlying premise of crowdsourcing is that a large number of volunteer participants can contribute a significant amount of data that is good enough for the intended use, though it introduces new challenges of participant recruitment and retention, and quality control of the data.
As with all crowdsourced projects, one of the key success factors is getting the right balance between giving data back to the data logging community to keep them engaged and benefitting, and also having enough commercial use of the data to ensure the financial viability of the project. Our approach here is that all actively involved in logging data will have free access to it for their personal and non-commercial use, but we are free to use the data for commercial purposes to enable us to keep operating TeamSurv.
Logging Tracks
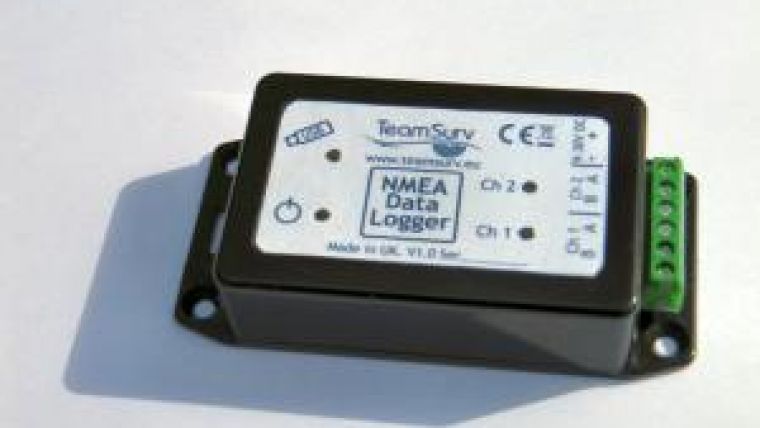
Participants can log data from their instruments in a number of ways. If their equipment can log NMEA data, they can use that. Alternatively, we have developed a two channel data logger that writes NMEA or Seatalk data to a USB memory stick (Figure 1), and also a software logger that can be run in parallel with the user's normal software. Whichever option is chosen, data is logged whilst the user goes about their normal activities, and is then uploaded to the server.
Before data from a logger is processed, they complete a calibration process. This calibrates the depth sounder by use of a lead line, gives us the relative positions of the sensors, plus details of the instruments used.
Once uploaded, data undergoes an extensive verification and quality control process. First, invalid GPS fixes are discarded - as well as relying on the fix quality flag, we also filter out data where there are inconsistencies in time or position. With depth data there is no validity flag, but we filter out values that are inconsistent with the others at a similar part of the track. At this stage we have the cleaned tracks (Figure 2), and this data is stored in the database.
We then apply corrections, the main ones being sea level and speed of sound; we also do trivial ones like translating the GPS position to the depth sounder transducer. For sea level, we use a combination of tidal predictions and tide gauge data. First, we apply tidal predictions, interpolated between tidal stations. The station locations are triangulated, with the final triangulation adjusted manually for the local topography. As a second stage we use actual tide gauge data, though this is much sparser than the predicted locations. We take the residual between predicted and actual heights, and then again interpolate this and apply it. As the tide gauge data generally comes in retrospectively, we reprocess data as required.
We also do speed of sound corrections, though this hasn't yet been rolled out to the production server. Although not as significant as for a multi-beam survey in deep water, there can still be a 6% difference between our trials areas in the Curonian Lagoon in Lithuania and South Brittany in France, for example. Here we use salinity and sea temperature data to determine the speed of sound, again triangulating data for each of these parameters and then determining the speed of sound as required.
At this stage we have the track data corrected, and with depths reduced to chart datum (Figure 3).
Some error sources cannot be corrected due to lack of data, but we are estimating the errors from these sources so we know how the overall accuracy is affected. The biggest issue here is the motion of the vessel, as there is no inclinometer or IMU, and the GPS is not accurate enough. However, in our analysis (using vessel motion data from various naval architecture sources, such as tank tests and CFD models) heave from waves has zero mean, so disappears with sufficient data density. Pitch and roll obviously tend to over read depths, but the wide beam angle of the depth transducer effectively filters out all but the most extreme pitch, and significantly reduces the roll errors.
Data Synthesis
We next combine the tracks to further enhance accuracy, and to build up a surface model of the seabed. The approach we have taken is to use an adaptive grid, subdividing to a higher resolution as the data permits - the greater the variability of data, whether due to an uneven seabed or depth differences between tracks, the greater the data density required.
We start with 200m grid squares, where we have sufficient data in each one, and then subdivide each quadrant as the data quantity and quality permits. In each square we use robust statistics to discard the outliers, and then look at the remaining data to generate a depth value, weighting data according to its estimated accuracy. Although the breadth of outliers is often quite large, we find that the depths are very consistent in a given area, more so than we initially anticipated (Figure 4). From these points we generate a surface, which is then used for contour generation. From this we generate output data sets and graphics, which are available from the TeamSurv website (Figures 5, 6). At this stage of processing we can also identify any vessels that are outputting data that is consistently different from the consensus and either get them to recalibrate their instruments, or exclude their data.
Accuracy
As always, for data to be useful, its limitations and levels of accuracy must be understood and made available to users of the data, and we are expending considerable effort on this.
The first consideration of accuracy is in understanding the limitations of the GPS and depth sounder. The GPS receivers used are standard marine navigation receivers, some of which are assisted by SBAS, but do not benefit from RTK. Tests on a range of receivers show an rms2 accuracy of about 2m, which is better than anticipated. The depth transducers are generally in the range of 6 - 12°, wider than those generally used for survey purposes, and so giving a lower spatial resolution on the seabed - accuracy tests on a number of typical depth sounders are planned for later this year.
Going on from here, there is the understanding of the accuracy of the system as a whole, so incorporating both those factors that we can correct for, such as sensor separation and sea level, and those we cannot, such as vessel motions. This then extends to errors introduced by the gridding and contouring processes. Work is ongoing in this area, and is being published on the website as it progresses.
Application Areas
We see two areas in which TeamSurv can be of use. First, there are many areas that will not have a full multi-beam survey. At present less than 15% of countries have more than 90% of their coastal waters adequately surveyed, according to the IHO. And over 50% of countries have half of their coastal waters either inadequately surveyed or in need of resurveying. There are many parts of the world where there are not the resources for current high-tech survey methods. And many areas where the authorities say it cannot be warranted, e.g. in areas not used by commercial shipping. Although TeamSurv cannot match the accuracy of a full multi-beam survey, it can be used to fill in the large parts of coastal waters which are unlikely to be surveyed in this way, with data that is likely to be both better than that on many charts, and also good enough for most navigational purposes.
Secondly, in areas where the seabed is liable to change, TeamSurv can monitor changes in depths over time, without the need to commit more expensive survey resources on a regular basis. This is really using it as a more methodical monitoring service than relying on reports from vessels in the area, or sending out a workboat to check on the depths. The TeamSurv data can then be used in its own right, or it can be used to trigger a full survey of the area.
So will TeamSurv replace high accuracy professional surveys? Definitely not. But equally definitely there is a place for it in the set of hydrographic tools, fulfilling a different role to that offered by professional survey vessels, for the many areas where the lower accuracy of TeamSurv is perfectly good enough for the data user.
Acknowledgements
Thanks to TeamSurv project partners Amber Route and MPG Software, and the EU's FP7 for partial funding of the project.

Value staying current with hydrography?
Stay on the map with our expertly curated newsletters.
We provide educational insights, industry updates, and inspiring stories from the world of hydrography to help you learn, grow, and navigate your field with confidence. Don't miss out - subscribe today and ensure you're always informed, educated, and inspired by the latest in hydrographic technology and research.
Choose your newsletter(s)


