Surveying the Thames Tunnel Route
The Thames is Liquid History
Following the suspension of Parliament in the summer of 1858 due to the ‘Great Stink’, an act was passed to allow construction of a network of giant sewers, pumping stations and treatment works beneath London. The system was designed by Sir Joseph Bazalgette and took both sewage and rainwater together. After heavy rainfall, when the flows were greater than the sewers could take, the excess was discharged into the Thames through one of 57 combined sewer overflows (CSOs).
After more than 150 years of service, the Victorian system is struggling to cope with the demands of modern London. The population has more than trebled and urban sprawl has expanded onto once open green spaces. Today, as little as two millimetres of rain can cause the network of sewers to overflow. This currently occurs around 50 times a year, causing as much as 39 million tons of sewage to flow into the River Thames.
As a result, the Thames Tideway Strategic Review was set up to assess the environmental impact and propose a solution to the problem. As part of the solution, one of the most challenging engineering projects of the 21st Century was devised, the Thames Tunnel. This tunnel will deal with 34 of the most polluting CSOs along the Thames through central London and will lie up to 70 metres below the riverbed.
A Choice of Three Routes
Thames Water had developed three possible routes for the proposed tunnel. Starting at Acton in the west, the tunnel would then follow the course of the river from Chiswick down to Bermondsey, where it would either connect into the Lee Tunnel (currently under construction) or go directly to the pumping station at Beckton, Europe’s largest sewerage treatment works. The longest of the three routes was up to 36 kilometres along one of Britain’s busiest inland waterways.
Though many thousands of hours of survey had previously been conducted for navigation and countless boreholes constructed during the development of the capital, there was insufficient information along the whole length of the three proposed routes to the depths required - up to 100m below bed level.
Environmental Scientifics Group (ESG) was approached by Thames Water to provide a variety of information using hydrographic and geophysical survey techniques along the whole length and width of the river. The data collected would be processed and interpreted to provide a model of the river bed and the geology along the route for detailed design works, as well as information to allow safe access for drilling platforms which were scheduled to provide ground truth for this model.
The Challenge Begins
Accurate positioning along the river was critical. With a number of GPS black spots along the route, caused by bridges, tall buildings and vertical river walls, the choice of positioning equipment was of prime importance. ESG’s solution was to utilise its Applanix Pos–MV system due to its inertial aided RTK navigation capability, which maintains position in black spots with almost instantaneous GPS reacquisition after an outage. The RTK corrections were received from the Leica SmartNet network correction service. System accuracy checks were conducted along the whole route prior to mobilisation on to the survey vessels.
To provide bathymetric data along the entire 36km route, ESG performed a multi-beam echo sounder survey. Side-scan sonar and magnetic gradiometer surveys were also conducted to provide an image of the riverbed and to identify any potential unexploded ordnance (UXO) - explosive weapons that did not explode when they were deployed - that may have been buried in the sediment. Given the Capital’s history, this was considered a significant risk along the route, particularly for the establishment of the jack up platforms for the planned intrusive investigation phase.
The multi-beam survey was conducted from a 7.9 metre Cheetah Marine catamaran with a draft of 0.3 metres. Data was collected using a Reson Seabat 7125 multi-beam echo sounder.
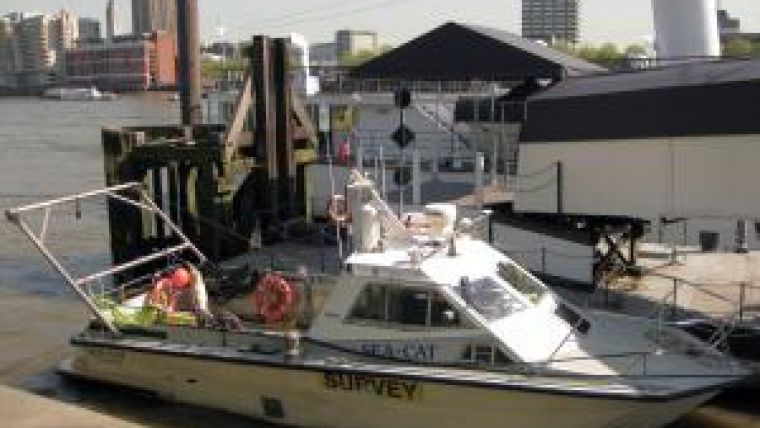
The Seacat, an 11 metre Halmatic Reliance with a draft of 1.2 metres, was used for two separate phases of the works. The draft of the vessels used was critical for the survey works due to the tidal nature of the river and the need to survey as close to the high water line as possible. Similarly, up-stream the river became very shallow, even at high water
The first phase of the work was a UXO survey of the riverbed which involved deploying a magnetic gradiometer as well as collecting shallow ultra high-resolution single channel marine seismic reflection data.
The data was collected in specific areas along lines no more than 5 metres apart. Critical to the success was ensuring that the magnetometers were as close as possible to the river bed. In order to achieve this, riverbed levels and depth sensors on the magnetometer tow fish were monitored in real-time throughout the survey. A Sonardyne USBL system was used to provide an accurate underwater position for the side-scan sonar towed fish.
ESG would also collect ultra high-resolution single channel reflection data down to approximately 50 metres below river bed using a boomer sound source. Data was collected using this technique along lines 10 metres apart with regular cross lines along the whole route to aid in the processing and interpretation.
Side-scan sonar data was collected at the same time to allow both the assessment of sediment distribution along the route as well as identifying the presence and location of any obstructions on the riverbed.
A 14-metre steel workboat was used to deploy the high-resolution multi-channel seismic reflection equipment. Data was collected along three lines extending the whole of the 36 kilometre route down to in excess of 100 metres below river bed. A significant amount of deck space was required to allow the twenty-four channel, two metre interval streamer to be deployed and recovered together with its depth controlling ‘digibirds’.
Initially, a fresh water sparker was trialled as a ‘low noise’ alternative to a more traditional water gun in an attempt to minimise disruption to the numerous houseboats along sections of the route. A Sodera S15 water gun was also deployed, which required space for a large compressor to be placed on the deck. On comparison of the results, it was agreed to conduct the survey using the water gun.
The Seacat was used as a chase/guard boat for this part of the survey. Given the streamer was flown at a very shallow depth and the survey route meandered quite significantly to safely navigate through bridges and around other river obstructions, accurately assessing the feather angle, the angle between the direction of the streamer and the track of the vessel, would be a challenge.
Given the streamer geometry and ambient river noise, a USBL system mounted on the workboat would not reliably position the streamer as the signals would have been attenuated too highly. Therefore, the streamer tail positional data was collected by a system mounted on the Seacat and telemetered to the digital data collection system aboard the workboat.
The multi-beam dataset was processed using Hypack HySweep with a final bin size of one metre agreed with the Thames Tunnel team. This was imported into IVS3D Fledermaus along with the available background mapping as the basis for the model.
The side-scan sonar dataset was mosaicked using CodaOctopous Geokit software, allowing sediment distribution to be mapped along the whole route.
The single channel seismic dataset was processed and interpreted using CodaOctopus’ Geokit / Survey Engine Seismic+ Software. Over 1000 line kilometres of data was processed.
The multi-channel data was processed using LandMark’s Promax software and fed into the SMT Kingdom Software Suite for interpretation. In multi-channel data processing each point on a reflecting geological layer is sampled many times as the shot point and hydrophone array moves past it. The processing sequence aims to enhance and clarify reflections by stacking them together in a complex but systematic way.
A significant amount of historical borehole data was available along the route and was provided by the Thames Tunnel Team in Association of Geotechnical and Geoenvironmental Specialists (AGS) format. Using ESG Soil Mechanics’ expertise and Keynetix HoleBASE Software, this dataset was imported, checked for consistency and a baseline geological model constructed by the interpretation team, which consisted of engineering geologists and geophysicists.
The geological model constructed from the borehole data was modified and refined as the seismic reflection data was interpreted, allowing a remarkably detailed model of the sub-surface along the whole route to be constructed. Reflectors were assigned to stratigraphic boundaries and folds and faults tracked consistently along the route. The data on each surface was then imported into Fledermaus and the final model completed.
Subsequently, when the over water borehole data became available, which included vertical seismic profiles and detailed chalk stratigraphy, ESG was able to refine the initial interpretation and provide the results by area, prioritised to meet the client’s design requirements.
This was achieved by redefining the seismic velocity model of the materials below the river bed and assigning more subtle stratigraphic boundaries to the reflection events already identified in the data.
A Never-before-seen View of the Thames Riverbed
ESG’s engineering geologists, with their specialist knowledge of London geology, were responsible for integrating the borehole data.
These geologists were able to identify subtle distinctions within the London Clay, spatial variations in thickness of the Harwich formation, the lateral variability of the clays, sands and gravels of the Lambeth group and track the marl and flint marker bands within the Chalk. These heterogeneities, combined with the complex structural features (faults, folds and scour hollows), added to the complexities of providing a continuous interpretation between the isolated borehole locations.
For the first time, a complete picture of the river and underlying geology was constructed enabling tunnels, faults, stratigraphy, scour hollows and bathymetry to be viewed at the same time, along with borehole locations and surface mapping.

Value staying current with hydrography?
Stay on the map with our expertly curated newsletters.
We provide educational insights, industry updates, and inspiring stories from the world of hydrography to help you learn, grow, and navigate your field with confidence. Don't miss out - subscribe today and ensure you're always informed, educated, and inspired by the latest in hydrographic technology and research.
Choose your newsletter(s)


