What Users Want in Their Bathymetry
Bathymetry User Needs and Challenges in Australia and New Zealand
More and more users are demanding bathymetry to support many new and different applications. New applications have necessitated changes in data acquisition and processing technologies to meet user requirements. The complexity of these requirements needs to be better understood if bathymetric datasets are to be multi-usable, whilst being fit-for-purpose. A survey of Australia and New Zealand user needs has been conducted to better guide the acquisition and processing requirements of bathymetry users.
Bathymetric Lidar is increasingly being collected to derive elevation for applications such as storm surge modelling, coastal inundation and vulnerability assessments. This bathymetry has also supported less obvious tasks such as marine habitat classification which take advantage of the Lidar pulse return intensity. The Australian Cooperative Research Centre for Spatial Information (CRCSI) and Department of Climate Change and Energy Efficiency (DCCEE) have recognised the growing interest and investment in these applications, and hence in bathymetric Lidar surveys around Australia.
Currently, there is no national programme or co-ordinated approach to bathymetry collection, with bathymetric surveys initiated on a needs basis by a variety of users to suit their individual requirements. Whilst this serves the initiators purposes, larger surveys, particularly Lidar (as they tend to have greater coverage) could be collected and made available to serve the needs of multiple users.
This project was initiated to better understand the reasons for near shore bathymetry collection in Australia and New Zealand and to ensure the appropriate specifications and technologies are being employed to satisfy user needs. By compiling a list of users, their needs, and technologies used to satisfy these needs, a near shore bathymetry collection can potentially be conducted using a co-ordinated approach with a focus on multi-use data.
The aim of the project was to identify common issues, data collection and data quality criteria that must be satisfied to ensure bathymetric data meets the needs of the user community.
Survey Respondents
The user survey was conducted by distributing a questionnaire amongst bathymetry users in Australia and New Zealand. The questionnaire was returned by 110 individuals from 82 organisations. The survey was distributed directly to 238 individuals covering 162 organisations. Networks were also used to approach additional users, of which 14% were from New Zealand, the remainder were from Australia.
Bathymetry Applications
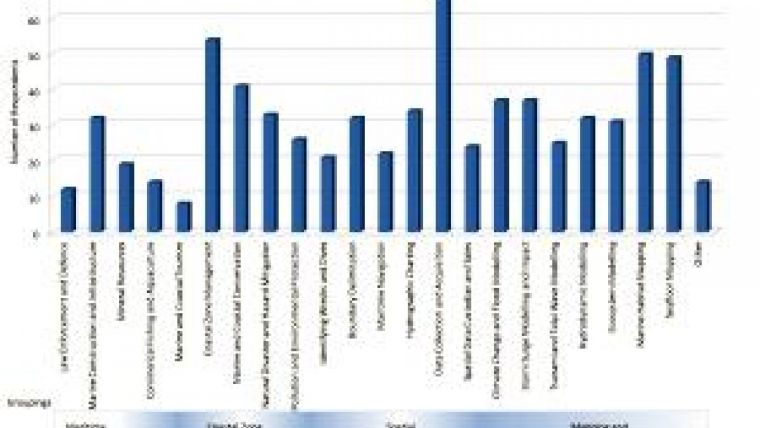
One of the aims of this project was to establish a list of applications which use bathymetric data. Figure 1 lists the main applications which respondents identified as requiring bathymetry. These 22 applications were then grouped into maritime operations, coastal management, spatial services, and mapping and modelling. It should be noted that the survey responses lacked adequate representation from maritime operations organisations. This was partly due to lack of responses from port authorities, mining, fishing and shipping companies. Therefore, the lower numbers of organisations involved in these applications was a reflection of the sample group and not the lack of prominence of maritime operations related applications.
Some notable features of Figure 1 were that 64% of respondents directly acquired bathymetry, and 60% of respondents are involved in at least one of the mapping and modelling applications. The use of bathymetry in coastal zone management also featured prominently. The users interacted with bathymetric data in different ways. We found that contours and 3D models were used nearly as much as maps to visualise bathymetry. The main form of analysis performed by users was to identify the location of features and boundaries.
Respondents predicted the largest increase in future applications would be in environmental mapping and modelling. Interest in environmental and risk forecasting in the nearshore has increased in recent years and individuals predict that this will continue to increase in the near future.
Bathymetry Acquisition
The majority of respondents (61%) directly acquire bathymetry themselves, with just over a third of respondents funding bathymetry acquisition projects. Only 16% of organisations obtained their bathymetry by data exchange only. Those respondents who acquired or funded bathymetry collection were required to nominate the technologies that they had employed in the past five years. As expected, maritime vessel-based bathymetry acquisition dominates other technology alternatives. Airborne bathymetric Lidar has been used by a significant portion (29%) of respondents. Other technologies respondents used to collect bathymetry include airborne electromagnetic bathymetry, autonomous underwater vehicles and hyperspectral imagery.
Figure 2 shows the technologies employed to acquire bathymetry. Two user groups from Figure 1 have been highlighted. Coastal modellers have been separated as their interests are of importance to DCCEE and the researchers. Maritime operations have been separated because they are under-represented within the survey respondents. The technologies coastal modellers employ to acquire their bathymetry are closely aligned with the overall user group. However, respondents involved in maritime operations were far more likely to use vessel-based surveys. The popularity of remote-sensing techniques for maritime operations was significantly lower than the overall group, whilst the use of multi-beam, single beam and side-scan sonar was higher.
The nine key features shown in Figure 3 were of interest to users of bathymetry. The most popular features of interest were reefs, closely followed by shoals. The remaining features were required by at least 30% of users which demonstrates the wide range of interests. Other features not listed and identified by a smaller number of respondents were small bottom objects, pinnacles, trawl tracks and marine mining features.
Coastal modellers have similar levels of interest in features as the overall group. However, maritime operations again were different. Their greatest interests were navigational routes which consist of shipping channels and ports/harbours, also man-made seafloor features such as pipelines and wrecks. Of less interest tended to be the natural features, including sea grasses, reefs and marine habitats.
Respondents were requested to identify problems experienced with acquiring bathymetry. Figure 4 shows the cost of acquisition as the most common issue, closely followed by data sharing with other organisations. If bathymetry is to be used by multiple users, a framework for data sharing needs to be developed. Interestingly, sourcing hydrographic surveyors has been an issue recognised and discussed at industry conferences however it appears to be a minor issue with the surveyed respondents. This could be due to several reasons, the most likely of which would be that the respondents consist of users, not just survey companies, and would therefore be unaware of this issue.
Across the range of issues, coastal modellers tend to have more issues than the overall group, and maritime operations less. This is most likely due to maritime operations historically acquiring their own bathymetry, as opposed to coastal modellers who tend to source it from other parties; hence the data was not entirely acquired for their specific purpose.
Using Bathymetry
The most common problems experienced with combining datasets in the nearshore are data resolutions (48%) and vertical datums (45%). Multi-resolution datasets are only in their infancy with limited analysis techniques. Most visualisation and analysis tools require grids of a constant resolution. This means that datasets of differing resolutions need to be resampled so the resolution matches before integration can be performed.
A number of vertical datums were identified as being of interest to respondents. The most common vertical datum of interest to users, with 45% interest, was the Australian Height Datum (AHD). Whereas, fewer users required bathymetry referenced to chart datum (36%), lowest astronomical tide (34%), mean sea level (28%) and the ellipsoid (17%). The interest in AHD is reflected by the 65% of users who require bathymetry to be integrated with adjacent topography for their applications.
Data formats (32%) and different times of data capture (25%) were also identified as issues although to a lesser extent. Temporal data can be difficult to integrate, especially in dynamic environments like the coast. Datasets which have different times of capture will contain different features depending on the amount of environmental change in the intervening period.
The top ten datasets used with bathymetry in terms of popularity are aerial imagery (53%), topography (38%), shoreline (31%), cadastre (14%), infrastructure (9%), benthic habitats (9%), planning zones (6%), seafloor characteristics (6%), tow video (5%) and coastal features (5%). An example of aerial imagery draped of bathymetry and topography is shown in Figure 5.
The final component of the questionnaire required respondents to rate listed bathymetry issues by degree of importance; with 5 being very important and 1 not being important. The top three issues identified by respondents in Australia and New Zealand were:
- Bathymetry acquisition cost and availability (average score 3.95)
- Bathymetry coverage (average score 3.80)
- Barriers to data sharing (average score 3.32)
Like anything else in life, these issues reflect the users’ requirements for more.... Bathymetry!
Conclusion
The user needs analysis has given credence to a number of Australian projects instigated to tackle various elevation issues; covering both bathymetry and topography. The survey has identified the wide range of bathymetry users in Australia. Their responses have provided requirements which will be taken into consideration in any new national acquisition of bathymetry.
The final report includes an analysis of additional outcomes and recommendations for future large area, nearshore bathymetry acquisition based on the user needs responses. A follow-up report will be produced later in the year reviewing bathymetric acquisition technologies and survey strategies. Used together, the two reports will provide better guidance for acquiring bathymetry in Australia using a combination of technologies to suit user needs.
Acknowledgements
The author would like to acknowledge the funding and support provided by the Australian Department of Climate Change and Energy Efficiency, as well as the contribution of the Australian Hydrographic Service and all survey respondents.

Value staying current with hydrography?
Stay on the map with our expertly curated newsletters.
We provide educational insights, industry updates, and inspiring stories from the world of hydrography to help you learn, grow, and navigate your field with confidence. Don't miss out - subscribe today and ensure you're always informed, educated, and inspired by the latest in hydrographic technology and research.
Choose your newsletter(s)


