When Bathymetry Determines Who Might Live and Who Might Die
Bathymetry can Focus the Energy of Tsunamis, Storm Surges and Wind Waves
The importance of bathymetry may be obvious to mariners, ocean modellers and marine geologists, but among the general public only the boating community seems to understand the importance of knowing water depths and the shape of the sea bottom. Most uses of bathymetry are not compelling enough to attract the attention of the general public, yet there are many instances where knowing the shape of the bottom can save lives. Most dramatic are those times when the coast is struck by huge tsunamis, storm surges or wind waves. The direction and size of these long waves are affected by bathymetry through wave refraction, which focuses their energy toward shallow ridges and away from deeper canyons. Many thousands of people have died because they lived at coastal locations toward which bathymetry focused the enormous energy of these long waves. The public needs to appreciate the importance of bathymetry in identifying coastal locations most susceptible to catastrophe when these marine hazards strike.
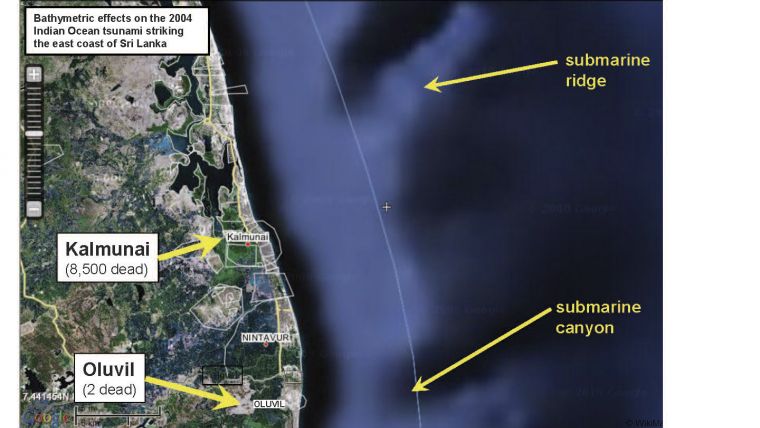
On 26 December 2004, the tsunami generated by the submarine earthquake off Sumatra took 1 3/4 hours to travel the 1100km westward to Sri Lanka. The tsunami travelled at the speed of a jet plane through the very deep waters of the Indian Ocean, but then slowed when it moved through the shallower waters of the continental shelf. The first town in Sri Lanka hit by the tsunami was the fishing village of Oluvil. Oluvil was not the most easterly point in Sri Lanka; it was struck first because it was located at the end of a submarine canyon that cut through the continental shelf. Because a tsunami is a very long wave (i.e., its wavelength is much greater than the water depth), its speed depends on the depth of the water through which it is travelling. The tsunami therefore travelled faster in the deeper waters of the submarine canyon and reached the coast sooner than it did to the north and south of Oluvil. Twenty minutes after Oluvil was hit, the rest of the 400km-long Sri Lankan east coast was hit by the tsunami. This part of Sri Lanka was a poor and vulnerable area where fishermen and rice farmers lived in small wooden houses near the shore. When the large tsunami waves struck, flooding the coast, the devastation was extensive. Half of the total deaths in Sri Lanka were along the east coast – 15,000 people dead, 10,000 injured and 800,000 left homeless.
Being the first to be hit by the tsunami was not a bad thing for Oluvil. Only two people there were killed, while just 13km north of Oluvil, more than 8,500 died in Kalmunai, making it the most devastated town in all of Sri Lanka. At Oluvil the water level simply rose and then fell like a fast tide, but at Kalmunai a violent 13m high tsunami wave struck with tremendous power, destroying everything in its path. Later the Oluvil fishermen called their survival a blessing, which of course it was, but there was a more scientific reason why Oluvil escaped the tsunami’s wrath. In Kalmunai, the surviving members of families wiped out by the tsunami would have found it difficult to comprehend that their tragic loss (while others just down the coast were barely touched) was determined by the shape of the sea bottom below the dark ocean waters to the east.
Tsunamis Amplified by Bathymetry
Oluvil was saved by being located at the shoreward end of a submarine canyon, while Kalmunai was demolished because it was near the shoreward end of a submarine ridge. The submarine ridge acted like a waveguide, the energy of the tsunami being focused onto the ridge by wave refraction. Because the speed of a very long wave like a tsunami depends on the water depth (its speed is proportional to the square root of the water depth), the parts of the tsunami in the deeper water on both sides of a ridge travel faster than the part of the tsunami in the shallower water above the ridge. The wave front therefore bends toward the ridge from both sides, focusing the energy onto the ridge and producing greater tsunami heights and thus greater flooding when the wave hits the shore. On the other hand, wave energy is focused away from the deeper waters of a submarine canyon, producing smaller tsunami heights when that wave hits the shore at the end of the canyon.
Off the east coast of Sri Lanka there is an alternating pattern of submarine ridges and submarine canyons, which on 26 December produced an alternating pattern of death and destruction—great damage, then less damage, then great damage again, as one moved south along the Sri Lankan east coast. Near Kalmunai at least five locations experienced tsunami heights greater than 9m, alternating with locations with heights less than 5m. Some villages had little destruction and many survivors, while other villages were completely washed away. (Kalmunai is only one tragic example of how bathymetry can affect the destructive power of a tsunami when it comes ashore. Other examples can be found in the first reference.)
Wind Waves Amplified by Bathymetry
Tsunamis are not the only life-threatening coastal marine phenomena that can provide tragic examples of how bathymetry can determine who might die. Over the centuries huge wind waves generated by offshore storms have destroyed countless lighthouses, and here again bathymetry plays a critical role. Wind waves over the deep ocean have relatively short wave lengths and their speed depends on their frequency, not on the water depth. But when wind waves move into the shallow waters near coasts they become long waves and they are also refracted by bathymetric variations, being focused along the shallowest water depths. Lighthouses tended to be put on a headland or point or even on an offshore reef to give them as much visibility as possible to distant ships. From a safety point of view, however, there could be no worse place to put them. Because of the shallow water around them wave refraction focuses the wave energy directly onto them, often with disastrous consequences when large waves are being produced by a storm.
The logbooks of more than one lighthouse keeper have reported the assaults of truly enormous waves. But worse, sometimes the evidence for such a monstrous wave was the fact that after a storm had passed the lighthouse and its keeper were gone, wiped off the face of the earth by the sea. Perhaps the most famous of the many lighthouses that fell victim to extremely high waves was the Eddystone Light, which was destroyed three different times by huge waves. It was built 23km from the Plymouth Breakwater in the English Channel on a treacherous group of rocks, where the shallower bathymetry could amplify the already large waves produced by North Atlantic storms. First built in 1689, Eddystone Light was originally a 24m high octagonal wooden tower. Henry Winstanley rebuilt the lighthouse in 1699 to a height of 37m with a ring of stone 1.2m thick up the first 6m of the base. He was so confident of its strength that he said nothing would please him more than to be in his lighthouse during a great storm. Four years later he got his wish. He was in his lighthouse when it felt the full force of waves produced by the great storm of 26 November 1703, one of the largest storms ever recorded in the British Isles. The entire lighthouse, with Winstanley and five others inside, was washed away, never to be seen again. Winstanley was but one of many lighthouse builders celebrated in Britain who battled enormous waves, including four generations of the famous Stevensons of Scotland, the family of Robert Louis Stevenson, author of Treasure Island. (See the first reference for more examples.)
Storm Surges Amplified by Bathymetry
Storm surges, caused by the strong winds of hurricanes and gales, are also very long waves that force huge amounts of water onshore, flooding thousands of square miles of coastline. As long waves they are also affected by bathymetry. Generally the shallower the water the higher the storm surge heights and the greater the flooding. The shape of the sea bottom also affects which parts of the coast are flooded more, but given other factors, such as the variations in the speed of the rotating wind field around the eye of the hurricane, it is usually much more difficult to see this bathymetric effect in the flood water heights measured onshore. But when storm surge computer models are run, more accurate and higher-resolution water depths produce more accurately predicted storm surge heights.
Communicating the Importance of Bathymetry
When the author wrote the book listed first in the references, bathymetry ended up being an important part of the story he wanted to tell. The main objective of the book had been to present a history of marine prediction that would get across to an educated general audience the impact of the sea on their lives and the importance of ocean physics. The approach was to interweave stories of marine disasters with stories of how scientists and mariners very slowly learned how to predict those moments when the sea would try to kill them. Most of the dangerous marine phenomena included in the book (tsunamis, storm surges, wind waves and the tides) are long waves, and as a result the importance of bathymetry became apparent in many of the book’s stories. The importance of bathymetry has been obvious for a long time to mariners, ocean modellers, marine geologists, ocean engineers and others who work on or by the sea, but among the general public only the boating community understands the importance of knowing water depths and the shape of the sea bottom. To a general audience its importance can sometimes be made clearer when they read stories that show how a knowledge of bathymetry can actually save lives.
In addition to being critical to reliable forecast models, accurate bathymetry is an important part in planning for marine disasters caused by tsunamis and storm surges and large wind waves due to storms. The public needs to appreciate the importance of bathymetry in identifying those coastal locations most susceptible to catastrophe when these marine hazards strike. Those in the field of hydrographic surveying understand the importance of accurate bathymetric data, but we need to continue to look for ways to communicate that importance to the general public as well as to those in government who should support these activities.
More Information
- Parker, Bruce, 2012. The Power of the Sea – Tsunamis, Storm Surges, Rogue Waves, and Our
- Quest to Predict Disasters, Palgrave-Macmillan, New York, 306 pages (paperback version; hardcover, 2010).
- Wijetunge, J.J., 2009. “Field Measurements and Numerical Simulations of the 2004 Tsunami
- Impact on the East Coast of Sri Lanka,” Pure and Applied Geophysics, vol. 166, pp. 593–622.
- Rohde, David, 2005. “In a Corner of Sri Lanka, Devastation and Divisions,” New York Times, Dec. 31.
- De Wire, Elinor, 1993. “Great Waves at Rock Lighthouses,” Mariners Weather Log, Fall, pp. 38-40.

Value staying current with hydrography?
Stay on the map with our expertly curated newsletters.
We provide educational insights, industry updates, and inspiring stories from the world of hydrography to help you learn, grow, and navigate your field with confidence. Don't miss out - subscribe today and ensure you're always informed, educated, and inspired by the latest in hydrographic technology and research.
Choose your newsletter(s)


