Data Set that Documents Changes in Sea Surface Temperatures Updated
A new version of a major sea surface temperature data set reduces systematic errors in measurements of one of the most important indicators of the state of the Earth’s climate system. Kennedy et al. present a major update to the U.K. Met Office Hadley Centre SST (HadSST), a crucial climate data set that documented changes in sea surface temperatures from 1850 to 2018. In this fourth version of HadSST, the researchers revisit and improve upon previous data adjustments and quantify remaining uncertainties, Tim Cook, a freelance writer for Earth & Space Science News, reports.
Natural and Anthropogenic Influences
Sea surface temperatures (SSTs) and temperature measurements from terrestrial weather stations are used to detect global change. They evaluate both natural and anthropogenic influences on the Earth’s climate. Historical records of SSTs extend back to the mid-19th century, but the technology used to make these measurements has varied significantly over the past 150 years. Such changes in instrumentation can result in systematic errors comparable in magnitude to the climatic variations observed during the same period. These inaccuracies must be corrected, and the uncertainties must be quantified, for scientists to isolate actual climate trends.
Discrepancies Between Measurements
Despite earlier attempts to identify and correct systematic uncertainties in historical SST records, such as discrepancies between measurements made by ships versus buoys, significant differences still exist between key data sets. These differences are especially apparent for the time period around World War II, which coincided with a protracted El Niño, variations in international shipping patterns, and poorly documented changes in how SST measurements were made.
Cook, T. (2019), Updating a crucial source of sea surface temperature data, Eos, 100, https://doi.org/10.1029/2019EO129985. Published on 31 July 2019.
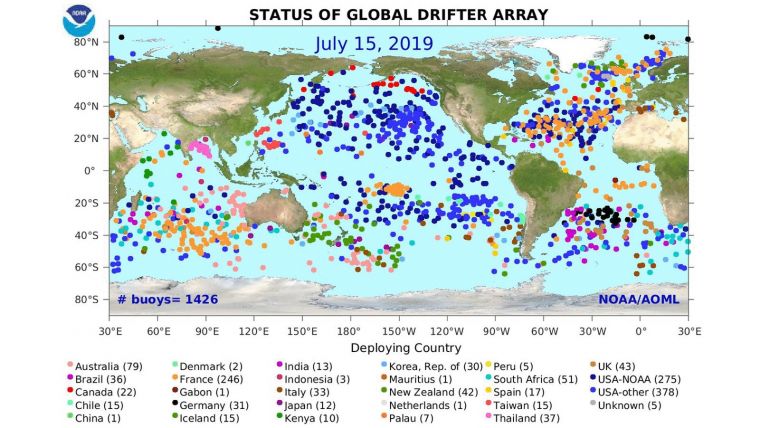
Illustration courtesy NOAA's Atlantic Oceanographic and Meteorological Laboratory.
Read the full article here.


