Google Dives into the Ocean
Last week, Google launched Google Earth 5.0. This version includes the long-expected addition of oceanic images and bathymetry. People will be able to see the underwater topography; search for particular spots or attractions; and navigate through the digital environment by zooming and panning.
Google Earth is not the same as "Google Ocean" by France-based Magic Instinct Software that uses Google Earth as a visualisation tool for marine data.
Oceanography researchers, however, say such a tool would be incredibly useful.
Google Ocean will feature a basic layer that shows the depth of the sea floor and will serve as a spatial framework for additional data, sources said, adding that Google plans to try to fill in some areas of the map with high-resolution images for more detail.
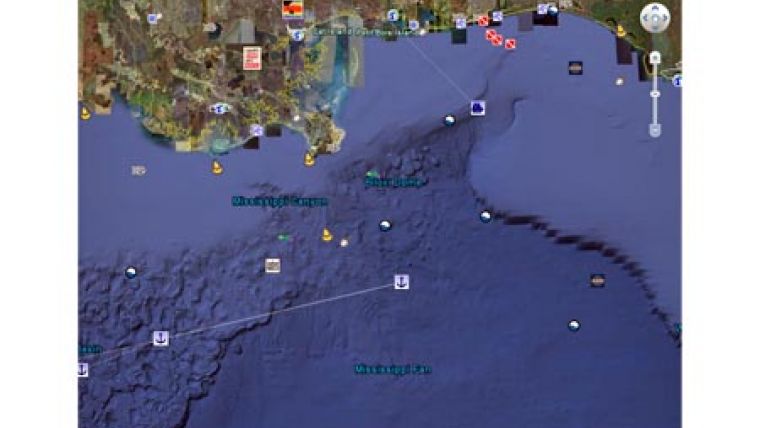
Additional data will be displayed as overlying layers that depict phenomena like weather patterns, currents, temperatures, shipwrecks, coral reefs, and algae blooms, much like the National Park Service and NASA provide additional data for Google Earth and Google Sky.
While satellite imagery has the entire globe covered, as well as a good amount of known outer space, much less is known about the bodies of water that cover about 70 percent of the planet. Only a small percentage of the sea floor has been mapped in detail by sonar.
To bring more clarity to the sea floor, Google will likely use high-resolution grids from oceanographic institutions showing the depths of select areas of the seas and paste them in. Data for those grids, which cover a very small portion of the sea floor, are created by ships using multibeam sonar.
One possible source for Google Ocean data are detailed "tiles" from multibeam and predicted topography compiled by the Lamont-Doherty Earth Observatory (LDEO) of Columbia University. Tiles are high-resolution sun-shaded images as well as digital elevation models covering the entire global ocean that allow for interactivity similar to Google Earth, where you can get different views by zooming in and out and by tilting the planet's surface.
On top of the depth map, and in addition to the select high-resolution tiled areas, there will likely be various layers of specialized data from different sources. For example, NOAA already has made public visual information for Google Earth related to sea hotspots around coral reefs, Gulf of Mexico marine debris, surface temperatures and wave heights in the Great Lakes, and shipwrecks.


