Hydrographic Survey Charting Using GIS
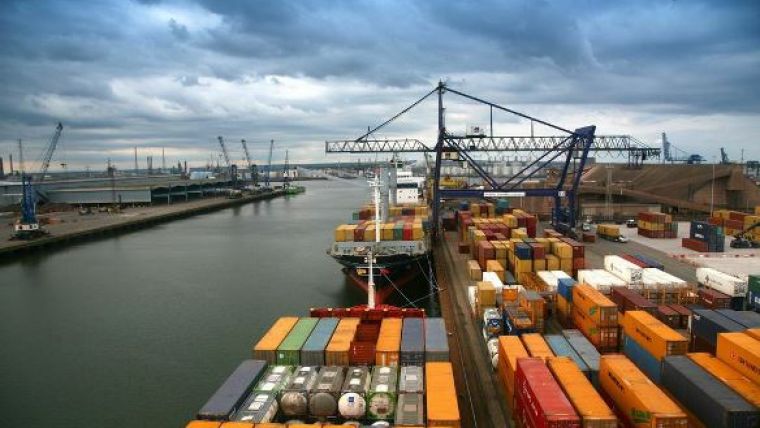
PD Ports is streamlining the way it shares hydrographic data by using GIS software from British software developer, Cadcorp, at Teesport. Handling around 40 million tons of cargo per annum, Teesport is a major deep-water complex and one of the largest container ports in the north of England. The first priority is to ensure the safe movement of the considerable amount of river traffic handling that cargo. Teesport relies a lot on hydrographic survey charts which provide an up-to-date record of the depth of the river in berths, approaches and channels.
Captain Jerry Drewitt, Harbour Master for Teesport and Hartlepool, explained that until recently, their survey department not only carried out hydrographic surveys, but also produced the associated charts. This is changing as they have come to recognise that having surveyors spend time on creating cartography was an unnecessary step in the sharing of hydrographic data, and was actually delaying data publication.
Hydrographic charts don’t only depict depth data, they also show topography and contextual data about features and boundaries along the river. The position of these features and their attributes, tend to be relatively stable - certainly when compared to the constantly changing topography of the riverbed, Captain Drewitt said. Teesport wanted the survey department to concentrate on recording this more dynamic hydrographic data. The less dynamic data – topography, assets, boundaries, Admiralty Charts, Ordnance Survey MasterMap, and aerial photography – can be managed as separate overlays in their GIS, Cadcorp SIS Map Modeller.
Composite
Teesport now create composite hydrographic charts by displaying the hydrographic data the surveyors capture, against whatever reference layers are appropriate for a task in hand. This is done in the knowledge that all features will be represented in their true location. Teesport now takes XYZ soundings directly from the survey department; drag and drop this data into the Cadcorp GIS, and pass it through a simple filter to indicate three categories of depth zones. Red indicates where the river is too shallow, blue where it is OK, and white where it too deep.
The outcome of these changes in working practices is to allow the Harbour Master to share information with the Vessel Traffic Service and pilots much more quickly than would have been the case. For example, whenever there is suspected slippage in the river bed, the survey department can be alerted to make a new survey of the affected area. The outcome of their echo-soundings will exported as XYZ files to Map Modeller. The GIS is used to delineate any areas which are deemed to be out of bounds. It is then a simple matter to insert a map into a Word document as a ‘Shoaling Notice’ which can be distributed by email.
Transitional role
It is apparent that Captain Drewitt’s introduction of digital methods of working is by necessity a gradual process. He remains convinced that at some point in the future his Deputy Harbour Masters and pilots will be able to accept map data from Teesport directly in digital form and in real time. However, for the moment GIS is playing a transitional role somewhere between a map creator and a map viewer. This can be seen in current project where Captain Drewitt is using GIS to match vessels to available berths. He uses the GIS to create and display templates of vessels originally designed as DWG files in AutoCAD.
By superimposing these templates, along with tugs and towlines, over maps and charts, it becomes possible to assess the maximum size of vessels that can be accommodated in different berths. It is easy to generate a family of templates, and a simple matter to superimpose them against maps noted Capt. Drewitt. While it is not yet possible to share them online, he can take map representations to meetings, where they serve an important evidential role.
Mike O’Neil, CEO Cadcorp, commented GIS applications don’t have to be complex to deliver real business benefits. Teesport have shown this. Their use of GIS is not about intricate analysis and modelling. On the contrary it is about the value you get by bringing together different data sets, quickly and easily. The combined value of these different data sets is often much greater than the sum of its parts.


