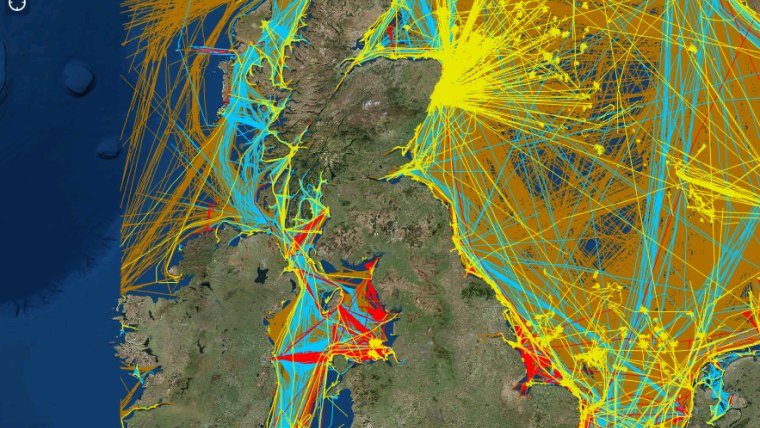
Marine Vessel Traffic Visualised
ABPmer has made available for viewing a new national dataset of marine vessel traffic for the UK. The data layers display AIS vessel transit lines from the Maritime and Coastguard Agency’s network of receivers, which ABPmer has mapped on behalf of the Marine Management Organisation. The dataset shows tracks by vessel type and a further layer shows the average weekly density grid (heat map) for 2015.
To create the layers ABPmer processed raw AIS data sampled from the first seven days of each month. The data processing follows the method contained in ‘Mapping UK shipping density and routes from AIS (Project MMO 1066)’.
The data provided 84 days of AIS information. This amounted to more than 1 billion position reports representing more than 20 million nautical miles of vessel transits. By combining vessel transit data, a weekly density grid at a resolution of 2km2 (2,000m by 2,000m cell size) has been produced.
Monty Smedley, maritime specialist at ABPmer considers AIS as a valuable source of vessel information. Many port and harbour authorities collect this information but he finds they are are unable to interrogate and map the information in a meaningful way. ABPmer has specialised in decoding and mapping AIS for a range of marine safety and planning applications.
Identifying Marine Traffic Patterns
AIS stands for ‘Automatic Identifications System’ and is used by vessels to automatically transmit their position. AIS is carried by international voyaging ships with gross tonnage of 300 or more tonnes, and all passenger ships regardless of size. AIS is also carried by smaller commercial vessels, the fishing sector and leisure craft users.
Vessel transits can be examined to identify traffic of a certain type, for example, traffic associated with particular industry, berth or offshore activity.
It also is possible to identify shipping density and look at differences over time to identify shipping trends or changes on a seasonal, annual or project basis. And of course it is really valuable for informing EIA navigational risk assessments to understand the implications of planned developments and activities.


