New Maps Illuminate Monterey Bay Area Seafloor
New sets of maps in the USA reveal the diverse and complex range of seafloor habitats along 130 kilometres (80 miles) of the central California coast stretching north from the Monterey Peninsula to Pigeon Point. The publicly available maps can be used by a large stakeholder community to understand and manage California’s vast and valuable marine resources.
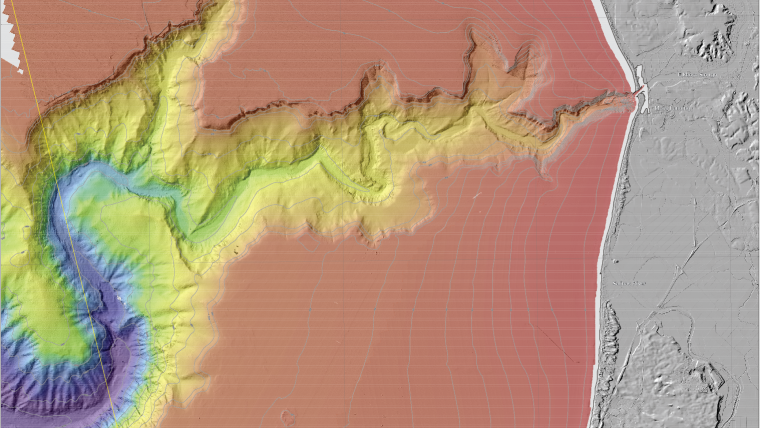
The new U.S. Geological Survey publications combine new and legacy data to reveal offshore bathymetry, habitats, geology and seafloor environments in stunningly high resolution. Environments range from the rugged granitic bedrock along the high-energy coasts of the Monterey Peninsula, to the bedrock reefs that form the world-class surfing point breaks on the Santa Cruz County coast, to the smooth sand and mud in a large delta bar at the mouth of the Salinas River, and to the steep walls and sinuous channels of one of the largest underwater canyon systems in the world.
Seamless Onshore-Offshore Maps
Seamless onshore-offshore geologic maps incorporating subsurface data document the location and geometry of the San Gregorio fault, and show how different strands of the fault extend through Carmel Canyon, cross the continental shelf west of Santa Cruz and Davenport, and combine to uplift Año Nuevo State Park and Año Nuevo Island. A separate fault system to the east in Monterey Bay is part of an actively deforming wedge of the Earth’s crust caught between the converging San Andreas and San Gregorio faults. The sets of California maps are Offshore of Pigeon Point, Offshore of Scott Creek, Offshore of Santa Cruz, Offshore of Aptos, Offshore of Monterey Canyon and Vicinity, and Offshore of Monterey.
The new publications include 10 map sheets, a pamphlet and a digital data catalog with web services. The web services are a new addition to these and all previous products in the map series, making it easier for people to find and use the digital data on a wide variety of devices, including smartphones. The maps and data have a large range of applications. They provide:
- A foundation for assessing marine protected areas and habitats, and for understanding how marine species such as bull kelp, rockfish, crabs, and sea otters use the seafloor.
- Baselines for monitoring coastal change and sea-level-rise impacts.
- Critical input data for modeling and mitigation of coastal flooding.
- A framework for understanding coastal erosion and developing regional sediment management plans.
- Contributions to earthquake and tsunami hazard assessments.
- More accurate data for safer navigation.
- Essential information for planning, siting, or removing offshore infrastructure.


