The IBCAO 4.0 Bathymetric Chart: New Depth Map of the Arctic Ocean
Scientists from the University of New Hampshire (UNH) and around the globe have published the most detailed map to date of the Arctic Ocean seafloor, which they hope will provide a glimpse of the geologic features that could affect global climate, the melting behaviours of the Arctic ice sheets, and ultimately sea-level rise.
Using all available depth data, including new state-of-the-art multibeam sonar technology, and sometimes surveying areas never before explored by ship, the new compilation now has approximately 19.8% of the Arctic Ocean seafloor mapped, representing a 13% increase from the previous chart compiled in 2012. This improvement is the result of many expeditions and mapping campaigns, including the Ryder 2019 Expedition north of Greenland which was co-led by Larry Mayer, director of the UNH Center for Coastal and Ocean Mapping (CCOM), and Martin Jakobsson, professor at Stockholm University in Sweden and affiliate assistant professor at CCOM.
A Better Understanding of the Arctic Basin
A description of the new digital depth data compilation was recently published by the group of researchers from 15 countries in the Nature journal Scientific Data. The chart is the newest version of the international bathymetric chart of the Arctic Ocean (IBCAO) project, which began in 1997 in Russia. Jakobsson is the current IBCAO chairman.
“The Center for Coastal and Ocean Mapping at UNH is proud to be a participant in the release of this new map of the Arctic,” Mayer says. “The increased resolution and coverage of this new map represent a great step forward in our understanding of the geologic and glacial history of the Arctic Basin, and that has many implications for improved understanding of future changes.”
Harsh Sea-ice Conditions
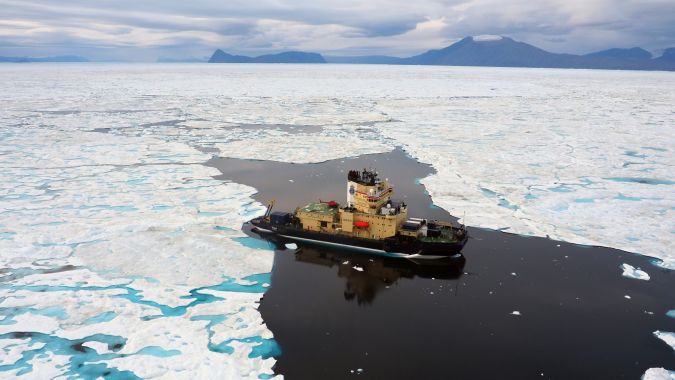
Scientists and explorers have long pursued Arctic travel and mapping despite – or perhaps because of – its inherent challenges. As the Arctic Ocean experiences longer periods of ice-free conditions, ships are now better able to navigate through the region, allowing scientists to study the world’s northernmost water body and ocean basin in more detail than ever before. To that end, Mayer and other researchers from CCOM have made significant bathymetric data contributions in recent years, mostly aboard the U.S. Coast Guard icebreaker Healy, where they mapped the seafloor to help establish the limits of U.S. jurisdiction in the Arctic under the Law of the Sea Treaty. Mayer then joined forces with Jakobsson aboard the Swedish icebreaker Oden for the 37-day Ryder 2019 Expedition in northern Greenland.
According to Jakobsson, the Oden was the first ship to ever enter the Sherard Osborn Fjord in northern Greenland where the Ryder Glacier drains. The region north of Greenland has been very poorly mapped, he says, because of the harsh sea-ice conditions in the Lincoln Sea that make it nearly impossible for all but the most powerful icebreakers like the Oden to navigate.
The shape of the seafloor can have a major impact on how deep currents flow and when glaciers and ice sheets will melt, which can then impact sea levels. Jakobsson underscores the importance of gleaning this information and ensuring that it is as precise as possible.
Continue here to read the full story