Excited by Automation Driven by Autonomous Vehicles
Hydro International Interviews Capt. Shep Smith
NOAA is one of the bigger organisations in the world that has surveying and charting in its portfolio. It’s an immense task as the USA has about 95,000 miles of coastline, important ports and a wide range of users – from recreational boaters to the biggest container vessels and tankers. The country also has to deal with environmental disasters like hurricanes and oil spills. NOAA is undergoing changes as the chart portfolio is ‘going digital’ and new initiatives such as using Maritime Autonomous Systems (MAS) for surveys. Hydro International has interviewed Capt Shep Smith, who generously gave an insight behind the scenes.
Your most recent accomplishments focus on improving charts and charting workflow. Where is there more room for improvement?
We need to make the whole chart system simpler and support faster updates. In the era of Google Maps, we have come to expect our maps to be seamless and continually updated. In online mapping, there is no such thing as individual maps or editions.
New generation navigation systems — chart plotters, tablets and mobile devices — and web mapping applications increasingly use tile services like Google Maps. Currently, these systems use tile sets created from our raster navigational charts. This is time consuming and awkward, since multiple charts may cover the same area at the same scale and one chart must be chosen to populate each tile. As a result, the companies that do this to support their deployed systems only update their tiles once or twice per year.
Over the coming year, NOAA will roll out a set of chart tile services compatible with these systems. NOAA will update these tile sets weekly with the latest Notice to Mariners and any other changes to the charts that are made that week. These tile packages can then be updated with weekly ‘delta’ packages, containing only the tiles that have changed since the last full package. This will dramatically reduce the bandwidth requirements necessary to keep a vessel’s chart suite up to date.
We have a huge opportunity now to dramatically reduce the time it takes to update charts. When we were printing editions of charts every few years, we would save changes to the charts on a working version of the chart and only release it to the public at the time of a new edition, which added several years of latency from the time an observation was made until it was available for use. We needed to publish changes to more dynamic features, such as aids to navigation or channel depths, in the Notice to Mariners in order to make them available to the public.
We now use a print-on-demand system for paper charts, so, with the end of paper inventory, there is no reason to hold back changes to the charts. NOAA has quietly been updating its digital charts weekly for the past 18 months. These changes are no longer limited to Notice to Mariners corrections; they might include full hydrographic surveys or shoreline updates as well. We apply these updates to all versions of the chart, including the print-on-demand charts. We can now support digital publication of changes to the chart that happen on time scales of months. An ocean inlet that is reconfigured by winter storms could be charted accurately in time for the summer small boating season.
We also have a lot of work ahead to optimise our ENCs for electronic navigation using ECDIS and electronic charting systems. We have heard from users concerning too many alarms, discontinuous depth areas, chart clutter, and unclear symbology. NOAA ENC Online, serving our whole ENC suite as a web mapping service, was intended to serve as a base map for various ocean-related mapping projects and services, such as the United States Coast Guard Search and Rescue service. However, it would have been worth deploying the system if only for internal use. It was the first time that everyone in the Coast Survey had ready access to view our ENCs as a seamless suite, and we could readily see the inconsistencies and discontinuities.
As we near completion of the population of our vector charting database, we are planning a suite-wide update of our ENCs, examining all the features that cause alarms, with an eye to reducing the incidence of unnecessary alarms. We will look at the depth areas we digitised originally from paper charts, and augment the depth areas where we need to distinguish safe water from shoal water. We will review all isolated hazards, such as wrecks and obstructions, to ensure they have the attribution necessary to reduce false alarms and chart clutter.
During your time at the Marine Chart Division, you oversaw the end of government printed paper charts. Will there still be a future for paper charts?
I think most responsible ships and boats will continue to carry some paper charts to sea for some time to come, for the purposes of backup. However, the regulatory requirements will continue to become more relaxed. In the context of type-approved electronic navigation, backup chart suites may include only a subset of paper charts, and may not be hand corrected.
The transition to digital navigation with paper backup happened in the US recreational boating industry about twenty years ago. Most larger recreational boats use electronic navigation in the form of chart plotters and computer-based navigation systems as their primary minute-by-minute aid for navigation.
Many boats also carry a conveniently-bound regional book of charts that can be used on a small chart table or in the cockpit.
NOAA sees these commercial products as a critical part of its distribution system, in support of its mission to get up-to-date charts onto every vessel. Commercial involvement in distribution, including approved print-on-demand agents, allows us to focus our efforts on updating the charts with new information quickly, and to seek out the best available information to resolve charted discrepancies.
In the two years you were commanding officer on the NOAA Ship Thomas Jefferson, you cut the cost of mapping output by 50%. Where were these savings found? How did you implement them (so rapidly)?
We did not find any savings.
We compute the cost of hydrography by taking the annual cost of the ship, people and equipment and divide this by the annual output of the ship. The cost of simply having the ship, equipment and crew is about 80 percent of the total cost, while the cost to operate the ship is about 20 percent. In optimal conditions, Thomas Jefferson can survey about 200 linear nautical miles (LNM) per day with the ship, and about 50 LNM per day with each of two launches, for a maximum of 300 LNM/day. With a single crew, the ship can operate about 240 days at sea.
However, the ship is seldom scheduled for such a big year, and most projects do not use the ship and launches simultaneously for the whole project. The year 2010 was exceptional, when the ship had 220 days at sea, and most projects used the ship and launches simultaneously. As a result, we logged record productivity for the year, and since the cost does not rise in proportion to our operational tempo, the cost per mile was low.
Cost per lineal mile is only one performance measure, of course. Another is the high value of surveying an encroaching shoal, determining the least depth on an isolated obstruction, or disproving a position approximate submerged pile in the centre of a natural channel — measures that arguably improve navigation safety more than resurveying an area that turns out to be already adequately charted.
Looking back to the Deepwater Horizon disaster when you were on command of NOAA Ship Thomas Jefferson, what in your view was the biggest take-away for surveyors?
Interesting question. We really transformed ourselves from a hydrographic ship into a more general oceanographic ship in order to try to characterise the subsurface oil. We left our launches in the davits, and traded out some of our permanent crew for additional scientists with needed expertise. We formed a team of water sampling experts and bio-acousticians, and built a processing workflow for on board analysis of water column backscatter. We had to think differently, work differently, and use new tools, all to observe a phenomenon never before seen. The main take-away I had, from a technical point of view, was that there is an enormous amount of potential in water column backscatter to gain insight into both physical and biological phenomena. It reminds me a bit of early multibeam, when we started seeing evidence of lots of benthic phenomena, sand ripples, iceberg scours, etc. We saw interesting anomalies in the backscatter, such as internal waves, that could be the focus of studies for other disciplines.
What do you see as the biggest developments in recent hydrography for charting?
I am excited by the move toward automation driven by the autonomous vehicle market. On my ship, we are following a path toward greater automation that includes both our manned and unmanned platforms. As a first baby-step, we now have autopilots driving survey lines on the ship and its two launches. As we develop better adaptive mission planning and system health monitoring tools for our autonomous surface vessels, we plan to apply these to our manned systems as well. We are already benefitting from higher quality data and a reduced holiday rate from the autopilots, and we are looking forward to additional efficiencies and quality improvements from additional automation.
We could also turn that question around. Multibeam surveys have been good enough for charting purposes for some time, but charting has not kept pace with multibeam surveys.
We have often used the value of each additional foot (or decimetre) of a ship’s draft in a dramatic fashion to make the case for more accurate surveys of ports and approaches. However, our customary products, paper charts and ENCs, do not preserve enough seafloor detail to truly make use of the full detail of a multibeam survey to support navigation decisions to optimise the management of risk/return in ship movements from the sea buoy to the berth.
Last year, NOAA launched a pilot project in the Port of Long Beach, where we are helping pilots with ‘precision navigation’. We pulled together a high-resolution depth surface in S-102 format with real-time water levels, salinity, currents, wave conditions and winds. By using its new underkeel clearance decision support system fed by these navigation data streams, the Port of Long Beach will save an estimated USD10 million per year by eliminating the need to offload cargo from vessels offshore before they enter the port. That project showed the need for next-generation navigation systems capable of streaming interoperable charting and observation data into optimised planning and real-time decision making. NOAA is developing its NextGenNav concept now. The system’s precision navigation tool will address several navigation challenges, including a major advance from static chart depths relative to chart datum, to dynamic water depths representing the depth of water at the actual time of transit.
Recently, autonomous surface vehicles (ASVs) have been taken into service for very shallow water surveys. What are the first results?
I know of a number of projects to do this, I will focus on the experience on my own ship.
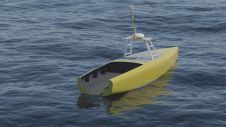
We have two small ASVs that draw about 0.2m with endurance of about 15NM at 4kt survey speed. We have used them to investigate shoals that are unsafe for our ten-metre long manned launches and to calibrate and validate satellite-derived bathymetry. Later this year, we will be using them to junction with bathymetric Lidar.
We commissioned the single-beam survey systems aboard our new ASVs as we would any other, with dynamic draft trials, timing checks, and a reference surface comparison with a trusted multibeam system. We have full confidence in the survey system and results.
Complying with US navigation rules, ASVs operate under the immediate supervision of an operator, who can assess the risk of collision and take appropriate action. This implies a requirement to maintain reliable and continuous communications with the ASV, even if it is surveying autonomously. This has proven to be a limiting factor, as our radio communications are reliable only to about 1 kilometre. Where it is available, we are looking at using shore side 4G infrastructure. We are also looking at longer-range marine radio telemetry systems.
The autonomy system we are using is still pretty rudimentary, basically able to follow a pre-programmed route. We envision additional behaviours to make the autonomy system better adapt to survey findings. For example, the ASV might be instructed to survey to the 1m curve, then break the line and proceed to the next. For a multibeam-equipped boat, it could create its next line to optimise coverage with the previous line. This example is under development at NOAA’s Joint Hydrographic Center at the University of New Hampshire.
Lastly, we have worked out first-generation deployment and retrieval systems for the ASVs from the ship and launches. These limit the operating window to benign conditions, even more than the survey operations limit, and way below survivability.
More broadly, NOAA is evaluating a broad range of autonomous vehicles to assess their capabilities, from light, calm-water ASVs to large blue water vehicles. We are also investigating new ship designs that will enable the deployment, recovery and support of these vehicles as we think about recapitalising our existing fleet.
What do you think of Lidar or Satellite-derived bathymetry data for nautical charting related to data from ASVs?
I see them as complementary. Where we can get high-resolution bathy Lidar or satellite-derived bathymetry, we should do so. However, in most cases, these are incomplete, due to areas of deeper water or higher turbidity. In some recent bathy Lidar surveys of Atlantic inlets, we got coverage only to 1-2m deep. We need to be able to chart both the safe water and the unsafe water, which means we need sonar to finish the survey. If that sonar work is in shallow water, we need a vessel appropriate to those waters, which might be a skiff or an ASV.
It is also important to recognise that survey standards require more than depth accuracy. They include requirements to systematically cover an area, determine the least depth on any significant features detected, and to disprove or otherwise address charted features in the survey area. While the resolution of bathymetric Lidar has improved in recent years, I would not yet say that we could use them to disprove rocks, wrecks and obstructions, such as submerged piles. High-resolution side-scan or multibeam sonar is necessary to confidently disprove and get least depths on submerged features.
How do you judge the added value of ASVs for hydrographic surveyors?
ASVs are an alternative to other types of manned vessels, and can be equipped with any sort of sensor package. The old saw for AUVs is that they are best applied to areas that are ‘Dirty, Dangerous, Dull, Denied, or Deep.’ ASVs have no particular advantage in deep water, and are readily visible, so are less attractive for denied areas, but the other three (‘Dirty, Dangerous, or Dull’) apply equally well to surface vessels.
As with any new technology, ASVs may allow us to do things we could not do before. In the case of NOAA Ship Thomas Jefferson’s operation, we are now able to survey safely in much shallower water than we could reach with our launches. (Dangerous). The boats we are using were adapted from systems designed for surveying in mine tailing ponds (Dirty).
We also envision ASVs to be used as an alternative to manned boats in order to gain extra productivity without additional staff. We might use them in a convoy formation to the mother vessel, effectively getting multiple swaths in a single pass, or we might give them their own work in an area deemed safe for them to operate. We are also investigating the possibility of having our boats optionally manned, so the same hull and sensors could be used for manned work when necessary, such as nearshore and in high traffic areas, and in an unmanned mode in safer water (Dull).
What do you consider as the minimum depth for ‘navigable waters’ to be surveyed?
For the last 25 years in the US, we have primarily focused our hydrographic efforts on areas critical to deep draft traffic. This was the right priority, as full multibeam and digital side-scan sonar have permitted us to find and measure least depths on thousands of rocks, wrecks and obstructions of potential danger to large ships. However, these systems, and the platforms on which they are deployed, have a practical safe inshore limit. NOAA has set this inshore limit at 4m, though often full coverage multibeam stops seaward of this curve. This limit is appropriate to the requirements of deep draft traffic, and to the tools we use to fulfil that requirement.
However, there are other hydrographic requirements for other user groups. While we focused on deep draft traffic, chart adequacy in near coastal waterways has degraded significantly. There are over 2000 reports of shoaling on NOAA charts, mostly in less than 4m of water. These reports come from vessels, often as the result of groundings or near-groundings, and are concentrated near harbours, inland waterways, and ocean inlets that are critical to our coastal towns, and the vibrant tourism, recreational boating and fishing industries. For most of these applications, the ‘too shallow to worry about’ limit is 1-2m. There are hundreds of smaller ports and small waterways for every large port, and hundreds of small boats for every large ship. The aggregate economic impact of recreational boating and small commercial boats is huge.
The US has 95,000 miles of coastline, and we cannot afford to resurvey all of these areas to the same level of care as we use in critical underkeel clearance areas for deep draft traffic. So I would propose a different approach: instead of surveying large areas systematically in order to find and resolve hazards, we should respond to chart discrepancies, resolving each through systematic surveys. These discrepancies might be reported to us directly, as were the 2000 cited above, through programmes like the one we have with US Power Squadron, where we compare the data to the chart, and chart shoal depths and contours as ‘reported’ if they are deemed credible and potentially dangerous to navigation.
Or they might be reported indirectly, such as through online cruising guides, or teased out of crowdsourced bathymetry databases, or from comparison of satellite bathymetry to the chart, or by examining AIS traffic patterns. The potential number of discrepancies from all of these sources is very high and represents a large amount of high return survey work.
Are there any new standards that we need to look at internationally? Vertical datums, projections, symbology, layers, inputs from radar, GPS, tide gauges and even cameras?
A year ago, NOAA hosted an ‘industry day’ at the Annapolis Boat show, where we invited all the navigation system manufacturers to hear short presentations and to meet with NOAA experts on various forms of environmental intelligence. We explained the availability of charts, high-resolution hydrographic data, tides and current station observations and predictions, full 3D hydrodynamic models of our coasts, weather, wave prediction models, high-frequency radar observations of coastal currents, and satellite-measured sea surface temperature. There was enormous interest in better integrating these datasets into the intermittently-internet-connected navigation systems that are in common use in the recreational and light commercial industry.
Eventually, there may be standards for some of these types of data, specifying formats, resolutions, etc. However, for now I think it wisest to let the open market start to settle on some priorities, use cases, and to develop some prototypes from which we can build standards later.
Shepard Smith
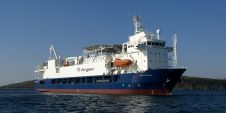
Captain Shepard “Shep” Smith is a career hydrographer with the National Oceanic and Atmospheric Administration. He has served as the US Deputy Hydrographer and as the head of the Marine Chart Division, leading chart production and distribution. He is currently at sea for an encore tour as the Commanding Officer of the NOAA Ship Thomas Jefferson.
[email protected]

Value staying current with hydrography?
Stay on the map with our expertly curated newsletters.
We provide educational insights, industry updates, and inspiring stories from the world of hydrography to help you learn, grow, and navigate your field with confidence. Don't miss out - subscribe today and ensure you're always informed, educated, and inspired by the latest in hydrographic technology and research.
Choose your newsletter(s)

