Using machine learning to derive benthic habitat maps
Deriving benthic habitat maps from hydroacoustic data using machine learning
The South African Council for Geoscience recently launched an initiative to optimize marine geophysical data collection in South African waters. The main aim of the initiative is to produce marine offshore maps with 100% seafloor coverage in the highest resolution currently possible, according to International Hydrographic Organization (IHO) standards. Scientists set to work and developed a tool to classify seafloor bathymetry and a predictive tool that classifies geological data into substrate maps using machine learning techniques.
In the recent history of southern Africa, there has not been a large-scale systematic marine geophysical offshore mapping project. This lack of data resulted in the Council for Geoscience initiating its own offshore mapping programme to optimize marine geophysical data collection. The main aim of the initiative is to produce marine offshore maps with 100% seafloor coverage in the highest resolution currently possible, according to International Hydrographic Organization (IHO) standards. One of the main focuses of the strategy has been technology and innovation in mapping, to better inform research projects and build on the collective knowledge in the marine sphere. The programme also plans to advance the public understanding of science exposing the character of the seafloor, which has been underrepresented up to now.
As South Africa collates and acquires new hydrospatial data, it is imperative that these datasets are used for a range of applications. Benthic habitat mapping considers the distribution of biological habitats, as chiefly governed by morphology and geological substrate, and lends itself to applications of machine learning, and the South African seafloor is both vast and variable in composition. This method of mapping using machine learning in combination with marine geophysical and biological data, tested in multiple sites across the South African coastline, will aid in improving our current understanding of the relationships between biota and physical habitats.
Technical specifications for data collection
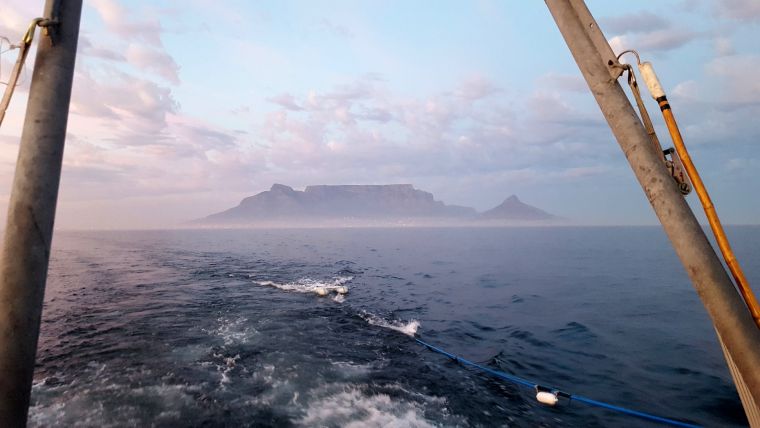
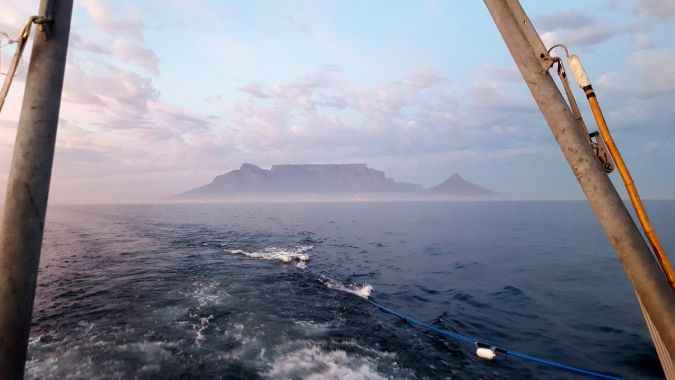
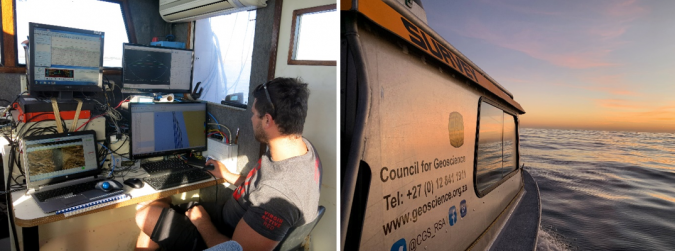
The multibeam bathymetry and backscatter data acquired from the investigations undertaken so far were collected using a pole-mounted 400kHz R2Sonic 2024 multibeam echosounder, with motion correction and dynamic positioning for the system provided by an Applanix POS M/V Oceanmaster inertial motion reference unit (IMU). Positioning was derived from a differential correction from a C-Nav 3050 DGPS. Survey line planning facilitated full seafloor coverage. The acquisition of data close to the coastline or in shoaling areas was not possible because of the presence of thick kelp beds and/or dangerous surf conditions. It took approximately 70 days to process and interpret ~5,000 kilometres of data, with all data acquired and processed using QPS Qinsy and Qimera software. The bathymetric data was levelled to Mean Sea Level using an SBET solution relative to the SAGEOID2010 orthometric model. The final bathymetric grid was resolved into 1m (shoalest depth) bins/tiles/pixels.
Conventional sidescan backscatter data was acquired using a dual-frequency (500/100 kHz) Klein 3000 sidescan sonar, which was towed behind the survey vessel using a CSW-9V winch. Lines were acquired using a scan range of 75m with 15% overlap of adjacent lines and full ensonification of the seafloor. The position of the towfish was determined using the reciprocal-layback method, transmitted in real time to the acquisition software via a radio modem. This data was processed using NavLog proprietary software to produce four sidescan sonar mosaics with a pixel resolution of 10cm. The multibeam derived backscatter data was processed using QPS FMGT to generate final mosaic with a 0.5m resolution.
Differentiation of machine learning techniques
Over the past two decades, machine learning has become a cornerstone in information technology, as increasing amounts of data are now available to scientists in various fields. This accumulation of data along with the need for efficient data analysis will become a necessary component for technological advancement in the future. Machine learning is based on computer modelling processes and their multiple manifestations; it combines task-orientated studies, cognitive simulations and theoretical analysis to interpret and understand a wide variety of datasets.
In machine learning, there are two main categories of data classification: namely supervised and unsupervised. Supervised classification refers to the use of image processing software that is guided by the user to specify the categories into which the data should be classified. During supervised classification, ground-truthed data is classified and then used to constrain the interpretation of the acoustic data. Unsupervised classification refers to a method where the outcomes (groupings of pixels with common characteristics) are based on the software’s analysis of an image without the user providing sample classes. The software then determines which pixels are related and groups them into classes.
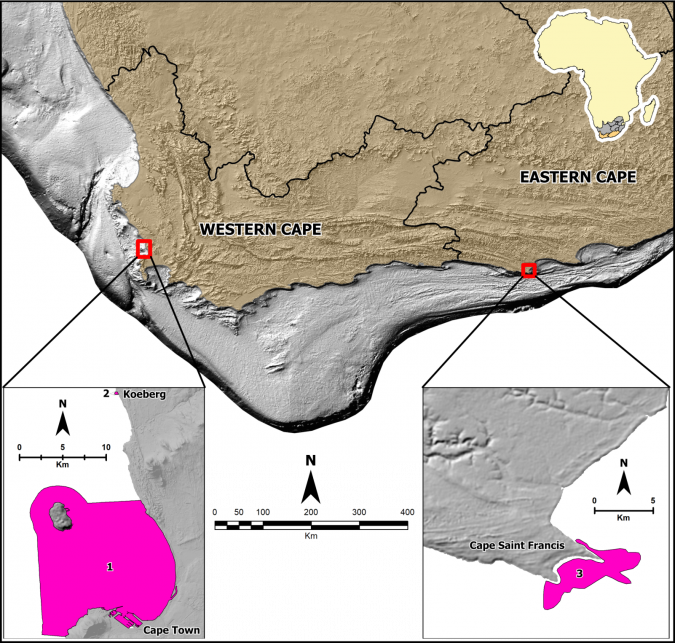
In the first phase of an initiative to develop capability to do semi-automated benthic habitat mapping in South Africa, three different machine learning techniques were tested in Table Bay, South Africa to find out which would be the most cost-effective, efficient, easy-to-use algorithm for the multibeam bathymetry, backscatter and sidescan sonar data collected by the Council for Geoscience, as part of a national offshore mapping programme. Initially, an unsupervised method of classification was chosen, with these results being compared to historical data interpreted in the area, to ensure a level of accuracy.
Decision Tree Classifiers, Random Forests and k-means clustering algorithms were used to classify the hydroacoustic data. These unsupervised classification methods were combined with a classification accuracy measure to ensure the validity of the results. The advantages and disadvantages of each algorithm were identified and the k-means clustering method was understood to be the best suited for our multibeam bathymetry and backscatter applications. This algorithm was conceptually simple and easy to implement, versatile, easily updated, efficient and computationally fast, and could store large amounts of data. The Decision Tree Classifier tended to over-fit data, did not work well with complex data or noisy data, whereas the Random Forest algorithm was slow in the pre-processing stages, and in generating predictions due to the multiple decision trees being output, the model is difficult to interpret.
Creation of substrate and benthic habitat maps using k-means clustering
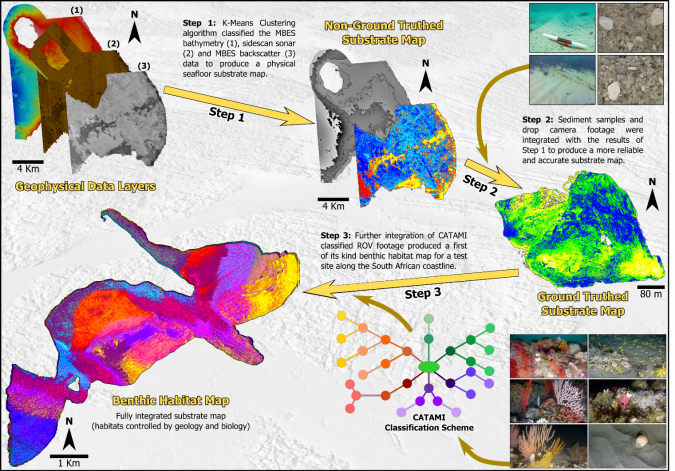
The k-means clustering algorithm was then used to create substrate maps in two contrasting study areas (Clifton and Koeberg, in South Africa), with differing geological settings. Drop camera footage and sediment grab samples were collected from the sites for the purposes of ground-truthing and improving the accuracy of the k-means clustering algorithm. Drop-camera footage was classified using the Collaborative and Automated Tools for Analysis of Marine Imagery (CATAMI) substrata classification scheme and sediment grab samples were processed using a settling tube. The statistics from the samples were used to define the sediment categories that were input into the clustering algorithm, in order to validate the results and reinforced by determining the measure of classification accuracy. The algorithm results reiterated that if it is supplemented with new data, with differing seafloor characteristics, and a combination of different input datasets, it can create more reliable and accurate final substrate map products.
The k-means clustering algorithm was further refined in an area that has significant variability in geology and terrain, in comparison to the first test sites that were composed mainly of unconsolidated sediment. Multibeam bathymetry, backscatter and ROV footage were collected in Cape St Francis, South Africa, and the hydroacoustic data was processed using machine learning k-means clustering. Eight ROV dives took place along the three transects, ranging from 30-80m in depth and the ROV footage was classified using the CATAMI substrata classification scheme. The most common Phyla ordered from most abundant to least abundant were; Cnidaria, Mollusca, Echinodermata, Chordata (fish species), Arthropoda (Subphylum Crustacea), Bryozoa, Porifera and Chordata (Class Ascidiacea). These species were identified both on rocky substrate and sand. Using this scheme, each species class was assigned a colour and input into the k-means clustering algorithm, which linked each sediment class of the substrate map to a species class. This was done using the k-means clustering algorithm as the intensity of the backscattered waves for species classes could be linked to the intensity of similar seafloor substrates. The algorithm was able to create a map with ten different benthic habitats that combined all the input datasets (multibeam bathymetry, backscatter data and ROV footage). The benthic habitat map of the area was able to use machine learning to identify and quantify different habitat types, accounting for geology, topography, sediment cover and species distribution.
Conclusion
Like most coastal nations, South Africa is exploring avenues to grow its oceans’ economy and better understand the marine environment, yet relatively little is known about the distribution of the country’s offshore benthic biodiversity. Given the considerable expense of sampling deep benthic biodiversity, models created from hydroacoustic data can be helpful in creating benthic habitat maps, which can in turn be used as surrogates for unsampled bioregions. With high quality and accurate modern hydroacoustic systems in combination with machine learning techniques, the ability to survey and sample in logistically challenging areas, with small operating budgets, can now be achieved. Furthermore, this study has demonstrated the importance of implementing machine learning techniques to improve map accuracy and reduce processing time.

Value staying current with hydrography?
Stay on the map with our expertly curated newsletters.
We provide educational insights, industry updates, and inspiring stories from the world of hydrography to help you learn, grow, and navigate your field with confidence. Don't miss out - subscribe today and ensure you're always informed, educated, and inspired by the latest in hydrographic technology and research.
Choose your newsletter(s)


