Chart Shows Antarctic Seafloor Topography
Reliable information on the depth and floor structure of the Southern Ocean has so far been available for only a few coastal regions of the Antarctic. An international team of scientists under the leadership of the German Alfred Wegener Institute, Helmholtz Centre for Polar and Marine Research, has succeeded in creating a digital map of the entire Antarctic seafloor.
The International Bathymetric Chart of the Southern Ocean (IBCSO) for the first time shows the detailed topography of the seafloor for the entire area south of 60°S. An article presented to the scientific world by IBCSO has now appeared online in the scientific journal Geophysical Research Letters. The IBCSO data grid and the corresponding Antarctic chart will soon be freely available in the internet and are intended to help scientists amongst others to better understand and predict sea currents, geological processes or the behaviour of marine life.
International research team
The new bathymetric chart of the Southern Ocean is an excellent example of what scientists can achieve if researchers from around the world work across borders. For the IBCSO data grid, scientists from 15 countries and over 30 research institutions brought together their bathymetric data from nautical expeditions. They have been able to work with a data set comprising some 4.2 billion individual values.
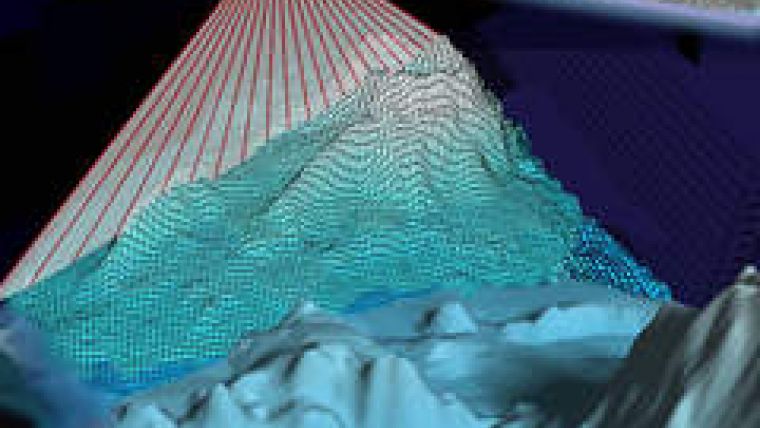
Collecting bathymetric data, as with the German research vessel Polarstern with its multibeam echo sounding system (image), was nowhere near enough, however, to develop a useful, three-dimensional model of the seafloor. The ocean south of the 60th parallel extends over an area of some 21 million square kilometres and is therefore around 60 times as large as the Federal Republic of Germany. Reliable bathymetric data have so far existed for only 17% of this area. The largest data gaps, for example, are in the deep sea regions of the south Indian Ocean and the South Pacific and in areas which experience difficult sea ice conditions throughout the year in some places, such as in the Weddell Sea.
Increased resolution
For this reason the mappers took the trouble to digitise old Antarctic nautical charts and to convert satellite data. They also used a mathematical trick by interpolating the data set. The IBCSO data grid has a resolution of 500 times 500 metres. This means that one data point reflects the depth of a sea area of 500 times 500 metres – a feature that leads to impressive degree of detail.
Where older models only offer a glimpse of a mountain in the deep sea, IBCSO shows an elevation with sharp ridge crests and deep channels in the slopes. A formerly flat point at the bottom of the Riiser-Larsen Sea can now be identified as an offshoot, some 300 metres deep, of the underwater Ritscher Canyon which runs along a length of over 100 kilometres from the south west to the north. And not far away from today’s shelf ice edge of the large Getz ice shelf the furrows are to be seen quite clearly which were ploughed into the seafloor by the ice tongue as it grew.
Currents model
Using this degree of detail IBCSO is primarily intended to push ahead with research. The depth data of the Southern Ocean are of great interest to polar researchers from many disciplines. The 3D data grids of the seafloor enable oceanographers to model currents and the movement of the deep Antarctic water which is of such great importance. Geologists are able to recognise the structures of geological processes more easily.
80% Still Uncharted
However, despite the elation about the new model and its chart, more than 80% of the area of the South Polar Sea is still unchartered. A few new research ice breakers are currently being built around the world and every one of them will presumably be equipped with a modern multibeam echo sounder in the same way as Polarstern.
Both the IBCSO data grid and a digital print template of the chart (dimensions: 100 centimetres times 120 centimetres) will be available for downloading to everyone soon on the project website at http://www.ibcso.org. IBCSO is a project of the General Bathymetric Chart of the Oceans (GEBCO). It is supported by the Intergovernmental Oceanographic Commission (IOC) of UNESCO, the International Hydrographical Organisation (IHO), the Hydrographic Commission on Antarctica (HCA) and by the Scientific Committee on Antarctic Research (SCAR). The geodesy and bathymetry working group of the Alfred Wegener Institute coordinates the project and is responsible for the entire modelling work.


