Enhanced North Sea management through updated seabed sediment mapping
Activities such as sand extraction, cable trenching and pipeline construction regularly churn up the top layer of the North Sea seabed. However, this top half metre is an important habitat for all kinds of animals and plants. The Geological Survey of the Netherlands, part of TNO, has used advanced technology to create an accurate digital map of the seabed. This map will enable public authorities and companies to make better decisions about activities in the North Sea.
The North Sea is an extraordinarily busy area, full of all kinds of activities. Shipping, fishing, wind farm construction and operation, cable trenching and pipeline construction from wind farms and platforms to the coast, sand extraction, nature conservation and military exercises compete with each other in most cases. Knowledge-based seabed management is essential if we want to facilitate all of these uses in the same space or alongside each other.
By avoiding muddy or gravelly seabed sediments, damage to the natural environment can be minimized. Churned-up mud smothers nearby benthic life, and ecologically valuable gravel plains recover poorly from damage.
The new seabed sediment map allows parties operating in the North Sea to make more responsible decisions, for example on preferred locations for shallow interventions on and in the seabed. The digital map is easy to consult and incorporate into environmental impact assessments (EIAs) that precede such interventions. Among other things, this makes it possible to visualize the spread of underwater noise during disruptive activities.
Accessible and accurate
“This seabed sediment map replaces a 20-year-old hand-drawn map and is many times more accurate,” says Sytze van Heteren, marine and coastal geologist at the Geological Survey of the Netherlands. “By applying artificial intelligence, we’ve captured the ratio of sand, mud and gravel in a grid model for all 58,500 square kilometres of the Dutch North Sea seabed. Users can incorporate our maps into their models and tools. They’re very accessible, available to everyone and easy to use.”
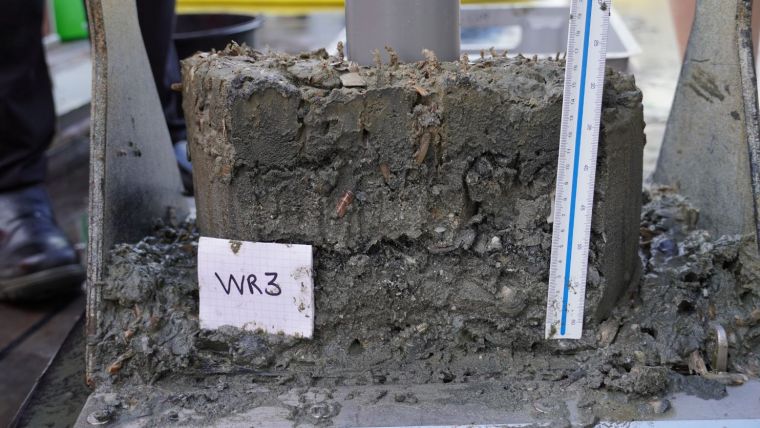
Geomodelling expert Willem Dabekaussen adds: “For each 100-by-100-metre block of seabed, we’ve produced a description of the expected composition and an image. The type and grain size of the sediments have been considered. For about 20,000 sites within the Dutch part of the North Sea, we have descriptions or lab measurements from which seabed type can be deduced.
“With AI and smart modelling, we’ve been able to predict the composition of the area between all those points. Of course, modelling never gives 100% certainty in every place. For each section of the seabed, we’ve therefore indicated how confident we are in the predicted composition. This is very useful for identifying where additional data is needed and where you, as a user of the map, should be careful about drawing conclusions. This distinction could not be made on the old map.”
More and improved information
“The database underlying the new map can be queried in various ways. We can use AI to quickly generate area-wide information on sand grain size or provide a secondary map on the percentage of mud in the overall sediment. Instead of a static, hand-drawn map, our clients can use very flexible knowledge products that better suit their needs. For example, they can find out in great detail the relationship between sediment type and the distribution of important benthic animal species. This works much better with 100-by-100-metre blocks than with hand-drawn areas of many square kilometres,” Sytze van Heteren explains.
Complex calculations
By applying AI and special algorithms, the Geological Survey of the Netherlands has succeeded in visualizing the upper layer of the seabed in an advanced manner. Willem Dabekaussen: “It was quite complex to calculate this for such a large area, but we profited from state-of-the-art techniques and enormous computing power. And this is just the beginning. It’s important to note that we can quickly and cheaply adjust any seabed map created with AI after receiving new data, thus gradually improving it. In this light, we call on parties operating in the North Sea to make their data from borehole or grab samples available to us.”
View the new seabed sediment map here.


