Building a 3D world: common sources of elevation data
The advantages of space-based radar
As the demand for elevation data continues to rise, it is important that users match the level of reliability, accuracy and resolution of the data to their specific application to arrive at an appropriate and cost-effective product. This article outlines the common sources of elevation data, including space-based radar, and helps to categorize the data quality and accuracy.
In the last decade or so, there has been a paradigm shift in geospatial mapping: maps have become three dimensional. This is a tremendous change within the industry as many professionals remember the days, not too long ago, when maps were flat and the commonly available suites of software products could not support the elevation data required to create 3D maps. It also is a tremendous change outside the industry. In the last few years, a wide range of organizations around the world – including engineering companies, scientists, emergency responders, infrastructure planners, departments of transportation, insurance and risk-analysis agencies – have increasingly started using elevation data for applications to support local, national and international needs.
Elevation data is often used in concert with location intelligence and other demographic, economic, environmental and political data to inform policy, spending and investment-related decisions. This data is fuelling innovation as it supports next-generation tools such as augmented reality for engineering design and digital twins for urban and environmental modelling.
As applications and benefits continue to evolve, the demand for elevation data will continue to rise. However, just as the maps it creates are dimensional, there are multiple levels of elevation data quality and positional accuracy. All levels of data serve a purpose, but it is important to match the application of that data with the level of reliability, accuracy and resolution required to arrive at an appropriate and cost-effective product.
Classifications of elevation data
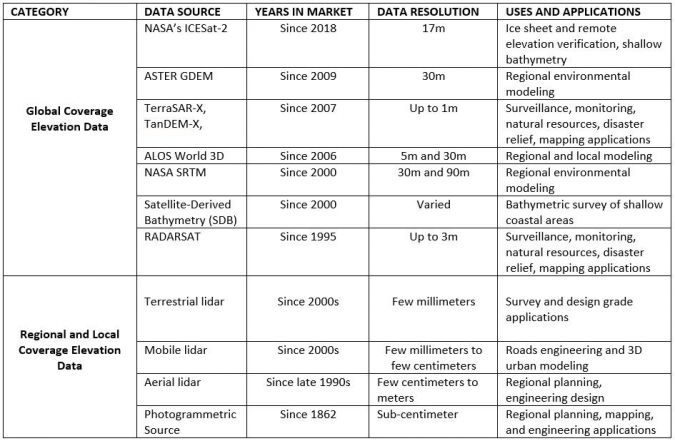
The higher the resolution is, the more accurate the elevation data will be in representing the terrain. Likewise, the higher the resolution is, the more expensive it will be to acquire and process the data. So how can accuracy and cost be balanced? Although there are no international standards for classifying elevation data quality and accuracy, this article attempts to provide a categorization scheme (see also Table 1).
Global-coverage elevation data
Publicly available, global-coverage elevation data is characterized by low resolution and low positional accuracy. Such data is useful for regional environmental modelling, especially in areas of the world where higher-resolution data does not exist. Most of this data is generated using space-based radar. Even though the quality and positional accuracy of products from space-based radar cannot compare with the quality of aerial Lidar, products from space-based radar have unique advantages – they can be produced in all weather, at any time and any place across the globe, from pole to pole.
Space-based radar also can measure relative changes in ground elevation down to millimetre-level accuracy. This is very valuable in monitoring changes in ground elevation, which is important for quantifying soil subsidence, polar ice thickness and similar applications. The high accuracy of measuring terrain elevation is relative and should not be confused with the absolute accuracy of the product, as it does not rise to that level of accuracy.
Prominent Examples of Space-based Programmes
1) Governmental satellite radar programmes
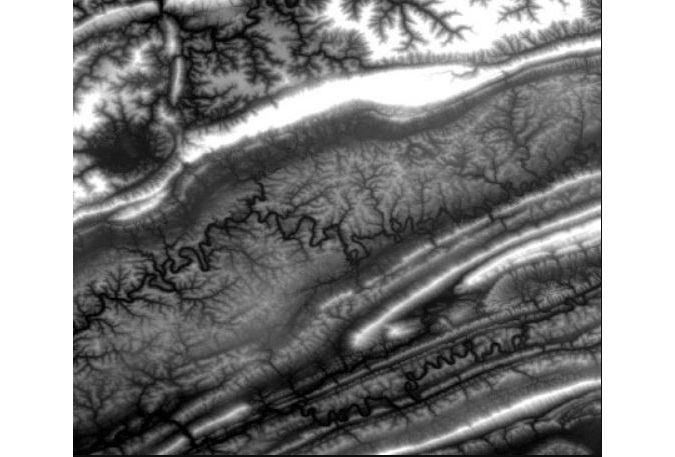
NASA’s Shuttle Radar Topography Mission (SRTM): This is an international research effort that obtained digital elevation models (DEMs) on a near-global scale from 56°S to 60°N. At the time, they generated the best global coverage using high-resolution elevation data. SRTM utilized imaging radar, which collected images from the Space Shuttle Endeavour during the 11-day STS-99 mission in February 2000. To ensure a stereoscopic (i.e. interferometry in radar) coverage with a single pass, SRTM was equipped with dual C/X-band antennas separated by 60 metres. The global SRTM coverage exists in 1 arc second (~30 metres) and 3 arc seconds (~90 metres) and is available on the US Geological Survey (USGS) website. Figure 1 illustrates a sample of the 1 arc second data over the Tennessee-Virginia border. In a study conducted by the USGS, SRTM vertical accuracy was found to range between 3 and 5 metres as root mean square error (RMSE), depending on the ground coverage category.
RADARSAT: In 1995, MDA built RADARSAT-1, a space-based Synthetic Aperture Radar (SAR) satellite, for the Canadian Space Agency to provide the government of Canada with enhanced surveillance, monitoring and management of Canada’s coastal and Arctic regions, fisheries, icy waterways, agricultural lands, natural resources, climate and fragile ecosystems, as well as to support highly operational defence capabilities and global disaster relief efforts. RADARSAT-1 was followed by RADARSAT-2 and most recently the RADARSAT Constellation Mission (RCM), which was launched in June 2019. RCM, which is a C-band SAR, acquires data with ground resolution of up to 3 metres.
ASTER Global Digital Elevation Model (GDEM): In 2009, the National Aeronautics and Space Administration (NASA), in cooperation with the Ministry of Economy, Trade and Industry of Japan (METI), developed the GDEM using stereo imagery that covered all land surfaces between 83°N and 83°S. They did this using the Advanced Spaceborne Thermal Emission and Reflection Radiometer (ASTER). ASTER is one of five instruments aboard NASA’s Terra spacecraft and was built in Japan for the METI. A joint US-Japan science team is responsible for its instrument design, calibration and data validation. The latest version, GDEM2, is offered with a 1 arc second (~30 metres) grid. The vertical accuracy of GDEM2 over CONUS was verified by a USGS team against GPS benchmarks and found to be around 8.68 metres as RMSE. On 5 August 2019, GDEM3 was released with enhanced quality but little improvement in its vertical accuracy. The horizontal accuracy of the GDEM is at about 72 metres.
Advanced Land Observing Satellite (ALOS) World 3D: In January 2006, the Japan Aerospace Exploration Agency (JAXA) launched the ALOS ‘DAICHI’, which was used in mission operations until May 2011. ALOS data is free as a global digital surface model (DSM) with horizontal resolution of approximately 30 metres (1 arc second). It was produced from the optical sensor on board the ALOS using the Panchromatic Remote-sensing Instrument for Stereo Mapping (PRISM). ALOS World 3D collects high-resolution data to generate a DSM with pixel size of 5m by 5m. This ALOS 5-metre DSM is considered to be the most precise, global-scale elevation data available.
NASA’s ICESat-2: On 15 September 2018, NASA launched the Ice, Cloud and land Elevation Satellite-2 or ICESat-2. The satellite measures the elevation of ice sheets on Earth to within an inch or so. Although the Advanced Topographic Laser Altimeter System (ATLAS), which is the laser sensor on board the ICESat-2, is designed to measure changes in polar sea ice and land ice, ICESat-2 collects elevation data over all water and land, from pole to pole, with a ground resolution of approximately 17 metres. This mapping capability has supported multiple applications for users around the world. ICESat-2 data can be used for bathymetric survey to a depth of to 25 metres in clear coastal waters. The data provides coverage of the globe along ground tracks of the orbital passes. However, track data is provided at 100-metre intervals, which makes it ideal for verifying terrain elevation in remote areas. The accuracy of ICESat-2 data was verified by researchers to be in the 0.20m range in open, moderately sloped terrain and 2m for mountainous terrain.
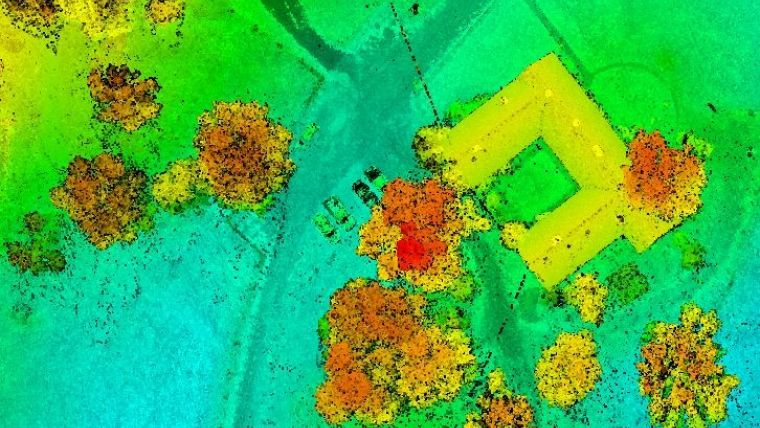
2) Commercial satellite radar: Space-based SAR is very effective in mapping geographic areas that are inaccessible to aircraft. It allows reconnaissance of a specific geographic area for a longer time because it is an all-weather sensor that can operate day or night and see through clouds. Although most space-based radar collections are designed for governmental, defence and intelligence reasons, some commercial systems are available for use by the public. The European Space Agency (ESA) space technologies, marketed through Airbus, offer various products from a series that includes TerraSAR-X, TanDEM-X and PAZ. Airbus commercially offers a suite of satellite-based digital terrain models (DTMs) with varied quality and accuracy through its OneAtlas portal. Airbus offers radar-based DTMs with resolutions ranging from 25cm to 40m (Figure 2).
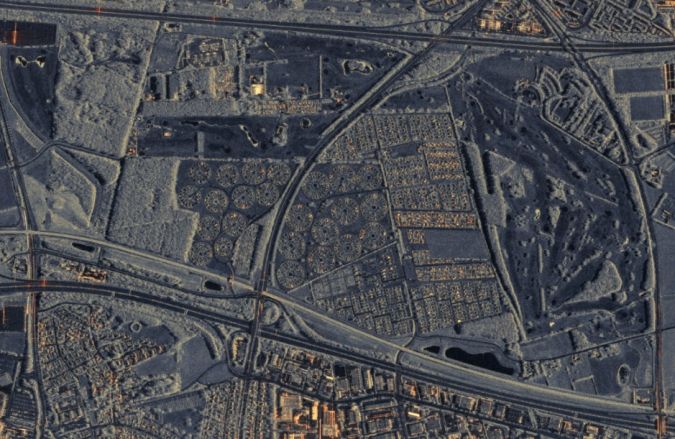
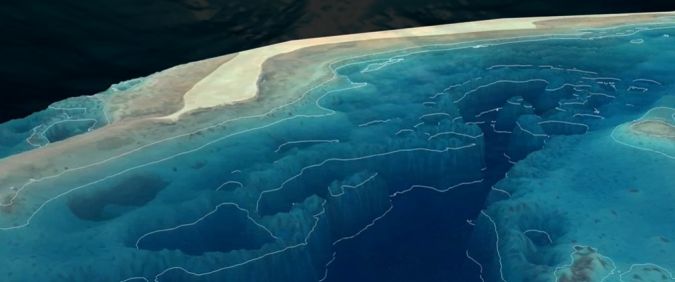
3) Satellite-derived bathymetry (SDB): This is one of most practical innovations in mapping submerged areas without the need to mobilize specialized bathymetric sensors or aircraft. It is a rapid and affordable source of shallow bathymetric data. Although it was first introduced by NASA and Jacques Cousteau in 1975 to map underwater around the Bahamas and off the coast of Florida, it did not become a popular means of determining the bathymetry of coastal regions until 2000. SDB utilizes physics-based radiative transfer models, i.e. ocean optical properties, to estimate near-shore bathymetry elevation values using published algorithms and readily available satellite imagery acquired from Landsat 8, SPOT or WorldView from DigitalGlobe. Coastal, blue, green and infrared bands are used to derive band/ratio elevation profile estimates, as seen in Figure 3. Valuable information on SDB developments can be obtained from the international Satellite-Derived Bathymetry Technology and User Forum. Commercial services are available from businesses such as EOMAP.
There may also be other commercial space-based programmes that offer global data on a paid basis which are not mentioned here.
Regional and Local-coverage Elevation Data
Local-coverage elevation data is:
- Higher resolution and more accurate than data for global coverage.
- Usually owned by private or public agencies and not shared with the public.
- Mostly not offered for free outside the USGS 3D Elevation Program (3DEP) in the USA. Some national programmes may offer data for free and for public use.
- Generated using two main methods: Lidar and photogrammetry. Imaging radar is also used on a limited scale around the world to collect elevation data. SAR is effective in mapping terrain under a dense canopy in all weather. However, data from SAR is characterized by lower resolution and lower accuracy than Lidar technology.
Photogrammetric sourcing of elevation data
Until Lidar was introduced in the mid-1990s, the stereophotogrammetric method was the most common method for generating accurate and detailed 3D models of the terrain and manmade features. Fundamental concepts of photogrammetry were first introduced in Europe towards the end of 19th century. In the USA, the earliest known application of photogrammetry was introduced by the Union Army in 1862.
The process starts with the acquisition of overlapping imagery flown from manned or unmanned aircraft. The imagery is then used either to manually compile the map using the principles of stereo photogrammetry or, more recently, by obtaining point clouds through computer vision and image matching. Depending on the scale of the imagery and the process applied, the positional accuracy can be as low as a sub-centimetre. High-resolution and accurate DTMs are usually compiled through stereophotogrammetry, where break lines and 3D mass points are used to model the terrain.
Lidar-based elevation data
In recent years, Lidar has become the de facto source for elevation data for its accuracy and detailed surface models. Lidar has the following advantages over the photogrammetric method:
- Since it is an active sensor that generates its own light rays, it can be used day and night. This widens the window of opportunity and makes its acquisition more productive and versatile than the photogrammetric method, which relies upon sunlight.
- It can see through trees and thick canopy, whereas tree shadows and canopy obscure the forest floor in photogrammetric imagery.
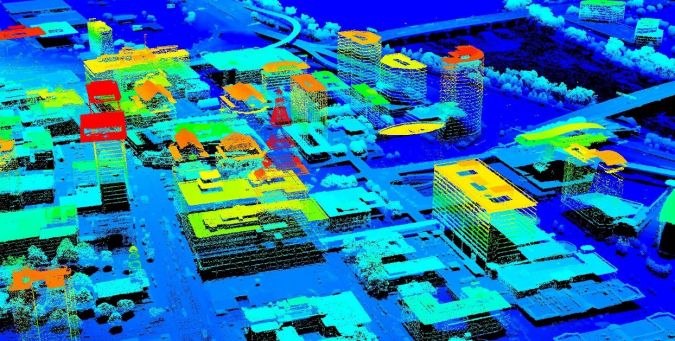
- It provides very dense point clouds that contain hundreds or thousands of points per square metre, resulting in detailed surface models (see Figure 4). Although it is possible, it is cost-prohibitive to achieve this point density with stereo-compiled DTM. New image-matching photogrammetric methods can generate this point density, but with a lesser quality than Lidar point clouds due to the shortcomings of the imagery in vegetated areas, as noted above.
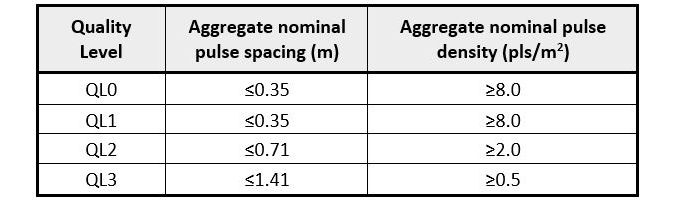
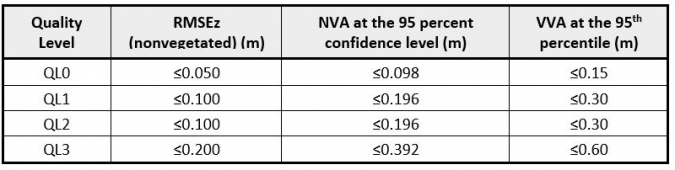
Lidar data can be acquired from various platforms, ranging from high-altitude, fixed-wing, manned and unmanned aircraft to moving vehicles and stationary tripods. Data quality and accuracy vary according to the user’s requirements. Stationary and mobile Lidar collects data with a density of thousands of points per square metre and accuracy as low as sub-millimetre. In the USA, the USGS 3DEP programme offers semi-continental coverage of Lidar data for free (see Tables 2 and 3).
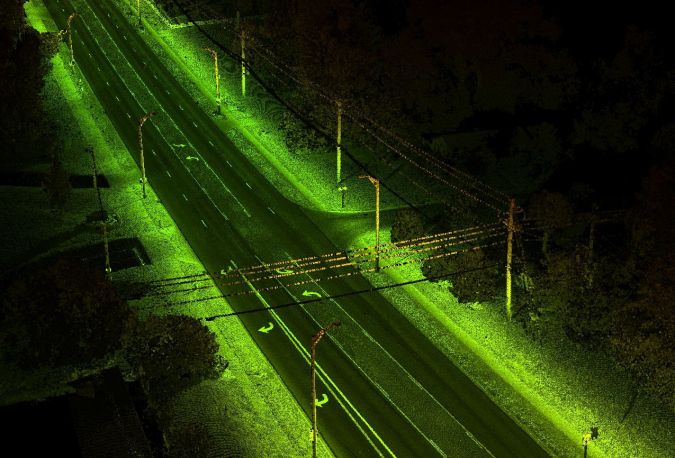
Many municipalities and engineering firms hire geospatial professional services to acquire high-density Lidar over their regions or projects. A mobile Lidar system is usually used for road design and road infrastructure inventory, since data from a mobile Lidar system is characterized by the highest resolution and accuracy (see Figure 5). The vertical accuracy of data from a mobile Lidar system ranges from 0.5cm to 2cm.
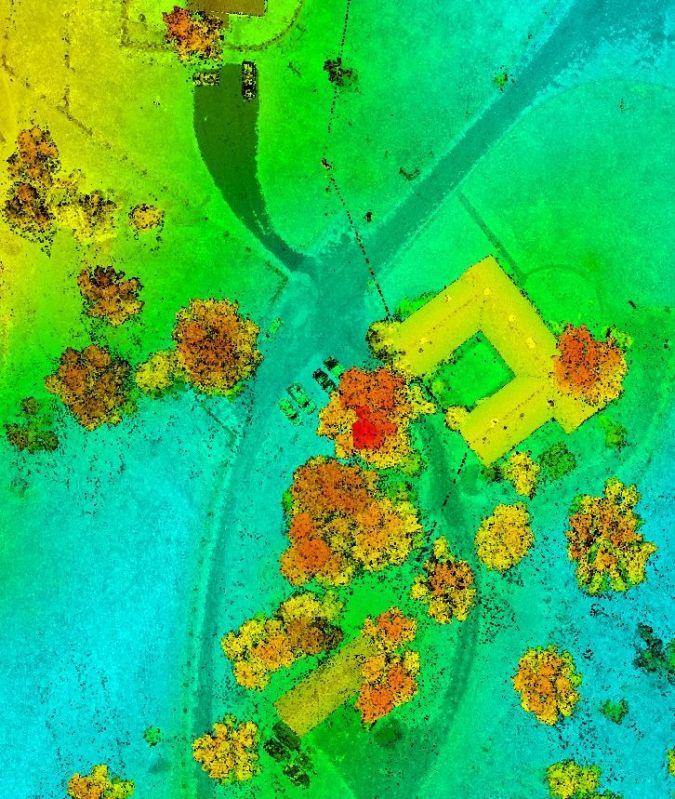
Surveyors utilize terrestrial Lidar, in which a Lidar system is mounted on a tripod, to model building interiors and exteriors to support building information modelling (BIM), as seen in Figure 6. The vertical accuracy of data from terrestrial Lidar is at the millimetre level. Meanwhile, Lidar collected via unmanned aircraft systems (UASs), as shown in Figure 7, is becoming more prevalent by the day. This Lidar acquisition method is very useful for projects that are too small to be cost-effectively collected by a manned aircraft.
Concluding remarks
Today, economies are closely tied to how well their nations are embracing the digital revolution. The 3D geospatial technologies that define this revolution are best represented by GNSS and positioning technologies, geographic information systems (GIS), Earth observation satellites, aerial and ground-based imagery, and active sensor technologies such as Lidar and radar. Besides its importance to each nation’s economy, geospatial information is enmeshed with the location-based sub-revolution that modern societies cannot live without. Everyone relies on accurate location information nowadays, but location is no longer in 2D terms. People have grown accustomed to the benefits and capabilities of the third dimension, i.e. elevation data, to design projects, model the impact of sea level rise and storm surge, predict flooding and model runoff, etc.

The rising use of digital twins and BIM has also spurred an unprecedented appetite for highly accurate, high-resolution 3D data. Nations are finding that geospatial information and digital technology can generate market opportunities, readily connect them with the world and their citizens, help them wisely manage their resources and create jobs.

Value staying current with hydrography?
Stay on the map with our expertly curated newsletters.
We provide educational insights, industry updates, and inspiring stories from the world of hydrography to help you learn, grow, and navigate your field with confidence. Don't miss out - subscribe today and ensure you're always informed, educated, and inspired by the latest in hydrographic technology and research.
Choose your newsletter(s)


